OPEN-SOURCE SCRIPT
Bollinger Levels Table - Horizontal Support Zones
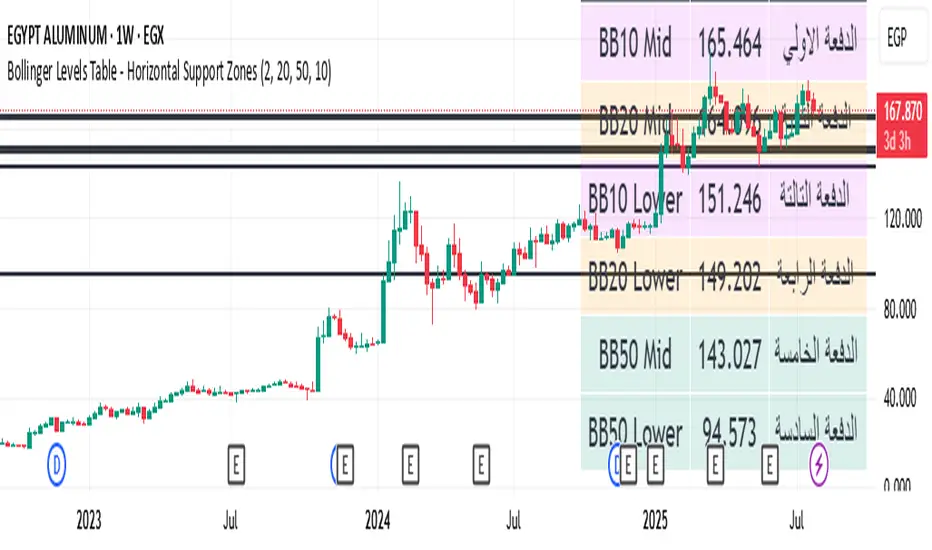
Bollinger Levels Table - Horizontal Support Zones Indicator (with Customizable Options)
The "Bollinger Levels Table - Horizontal Support Zones" indicator is a comprehensive tool designed to help you identify potential support areas on your chart using moving averages and Bollinger Bands. The indicator displays an organized table of key price levels and draws horizontal lines on the chart, providing clear visibility of potential support zones.
What Does This Indicator Do?
This indicator aims to simplify support analysis by consolidating and displaying significant price levels derived from three different Bollinger Band settings: BB10, BB20, and BB50. It calculates both the Mid-line (Basis) and the Lower Band for each of these settings.
Furthermore, the indicator automatically arranges these levels from highest to lowest in an easy-to-read table, assigning a "Payment" label to each level. These "Payments" are simply labels to help you track the levels in descending order.
How Does This Indicator Work?
Bollinger Band Calculations: The indicator uses the standard Bollinger Band formula:
Mid-line (Basis): A Simple Moving Average (SMA) of the closing price over a specified period.
Standard Deviation (Dev): The standard deviation of the closing price over the same period, multiplied by a Multiplier.
Lower Band: The Mid-line minus the Standard Deviation.
These calculations are applied to three different periods: 10, 20, and 50, providing a variety of potential support levels based on different timeframes. You can adjust the values for these lengths (10, 20, 50) and the Multiplier through the indicator's settings.
Table Construction: A dynamic table is created on the chart (which can be positioned in the top or bottom right corner based on the current price's position). This table displays:
Indicator: The name of the Bollinger Band level (e.g., BB10 Mid, BB20 Lower).
Price: The exact price value of that level.
Payments: A label indicating the level's order in the table.
Level Ordering: All calculated levels are dynamically sorted from highest to lowest to present them in a logical order within the table.
Horizontal Line Plotting: Horizontal lines are drawn on the chart for each selected level, providing a visual representation of the potential support areas. These lines are colored black and have a consistent width for easy identification.
How to Use This Indicator:
This indicator is intended to provide potential entry points or accumulation zones for trades, especially for traders employing Dollar-Cost Averaging (DCA) strategies or building positions in stages. The levels displayed in the table and on the chart can represent potential support levels where one might consider initiating or adding to a position.
In the indicator's settings, you'll find important options:
Multiplier: Controls the width of the Bollinger Bands (default 2.0).
BB Lengths: Allows you to adjust the periods for the moving averages (default 20, 50, 10).
Visible Levels: This is the new feature! Here, you can select which levels you wish to see in the table and on the chart. Simply check or uncheck the boxes next to each level (BB10 Mid, BB10 Lower, and so on) to customize the indicator's display according to your strategy and needs.
Underlying Concepts:
This indicator is based on the principle that Bollinger Bands can act as dynamic support and resistance zones.
Mid-line (SMA): Often functions as a medium-term support or resistance.
Lower Band: Typically indicates that the price is relatively low and may find support, making it a potential area for buying or starting to build a position.
By combining different Bollinger Band timeframes (10, 20, 50), the indicator gives you a multi-timeframe perspective on support areas, helping you identify the most relevant levels for your strategy.
Note: While the indicator provides "Payments" for the levels, this is purely a sequential labeling within the table to assist your position-building strategy. There is no actual payment functionality associated with this indicator.
Script open-source
In pieno spirito TradingView, il creatore di questo script lo ha reso open-source, in modo che i trader possano esaminarlo e verificarne la funzionalità. Complimenti all'autore! Sebbene sia possibile utilizzarlo gratuitamente, ricorda che la ripubblicazione del codice è soggetta al nostro Regolamento.
Declinazione di responsabilità
Le informazioni ed i contenuti pubblicati non costituiscono in alcun modo una sollecitazione ad investire o ad operare nei mercati finanziari. Non sono inoltre fornite o supportate da TradingView. Maggiori dettagli nelle Condizioni d'uso.