PROTECTED SOURCE SCRIPT
GARCH(1,1) [victhoreb]
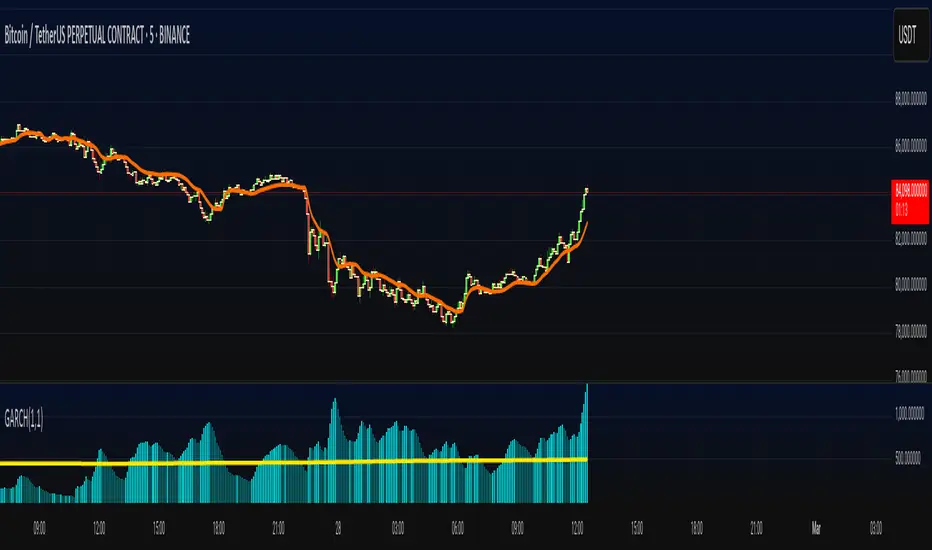
Generalized Autoregressive Conditional Heteroskedasticity p,q = 1 (GARCH(1,1))
The GARCH model is a generalized version of the ARCH statistical model, which describes the variance of the current error term (innovation) as a function of the magnitudes of the previous periods' error terms. Essentially, the GARCH model provides an estimate of the average volatility.
The model assumes that the time series { xₜ | t ∈ T } is given by:
xₜ = μₜ + εₜ
where:
- μₜ is the conditional mean of the series.
- εₜ represents the residual shocks, defined as above, and it is assumed that εₜ ∼ N(0, σₜ²) (this assumption, although important for statistical inference, may not hold perfectly in practice as residuals can exhibit heavier tails).
The conditional variance is estimated by:
σₜ₊₁² = ω + α · εₜ² + β · σₜ²
where:
- ω is a constant ensuring the variance remains positive;
- α measures the impact of recent shocks (the effect of the squared residuals);
- β represents the persistence of past volatility.
(!) It is important that α + β < 1 for the process to be stationary.
(!) The parameters ω, α, and β are assumed to be non-negative real numbers.
Here, σₜ₊₁ represents the forecasted volatility for the next period (t+1).
ADDITIONAL NOTES:
1. In the first bar, the future conditional variance σₜ₊₁² is defined as εₜ². This initialization is arbitrary and serves to start the recursive process. Alternative initialization methods may be used depending on the data.
2. The normality assumption εₜ ∼ N(0, σₜ²) facilitates statistical inference, though in practice the residuals might not follow a perfect normal distribution. Statistical tests and graphical analysis can be applied to assess normality and, if necessary, alternative distributions (such as Student's t or GED) may be employed.
3. The conditional mean μₜ is estimated using a weighted moving average (WMA) of the hl2 value (the average of the high and low), which acts as a proxy for the level of the series. In this setup, xₜ is set to hl2, and the model computes the conditional volatility for the next bar.
ADDITIONAL INDICATOR (MA):
An extra moving average (MA) calculated using GARCH(1,1) is plotted on the chart (its plot is optional and it can be changed in the indicator settings).
Script protetto
Questo script è pubblicato come codice protetto. Tuttavia, è possibile utilizzarle liberamente e senza alcuna limitazione – ulteriori informazioni qui.
Declinazione di responsabilità
Le informazioni e le pubblicazioni non sono intese come, e non costituiscono, consulenza o raccomandazioni finanziarie, di investimento, di trading o di altro tipo fornite o approvate da TradingView. Per ulteriori informazioni, consultare i Termini di utilizzo.