🔶 METHODS
• Pine Script™ introduces methods (1, 2)! Much kuddos for the developers, Tradingview, and all who has worked on it!
• This educational script will show the simplified way of writing built-in methods, not to create a new method.
🔹 Simplified way of writing built-in methods:
· Instead of:
Pine Script®
· We now can write it like this:
Pine Script®
——————————————————————————————————————————————————————————
· When using [1] sometimes brackets are necessary:
Pine Script®
· ->
Pine Script®
——————————————————————————————————————————————————————————
🔶 OVERVIEW OF SCRIPT
• The basic principles are:
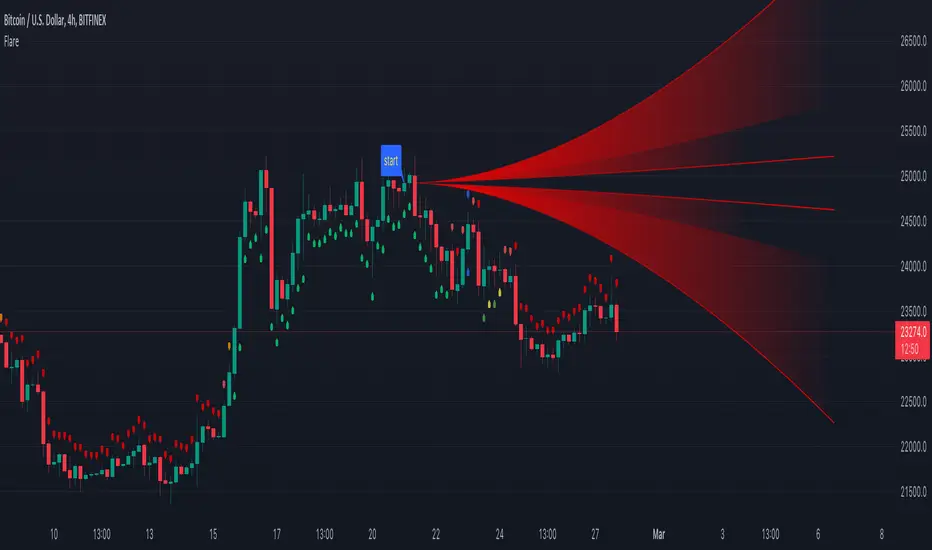
· Find 1 point (close) x bars back from current bar (settings: 'x close back').

· Create a 'Flare' shaped object from that point to current bar or further (dependable of "Width of Flare").
· Calculate where current close is located versus the Flare lines.
· On that bases, change colour and draw plotshapes.
· Below bar if current close is located in the upper part of the Flare
· Above bar if current close is located in the lower part of the Flare
· Above & Below if located in the middle part of the Flare
-> Above & Below colours has 3 different colours (adjustable), dependable on the position
🔶 EXAMPLES
· Neutral zone:


· Light Bullish zone:

· Bullish zone:

· Very Bullish / Overbought zone:

· Light Bearish zone:

· Bearish zone:

· Very Bearish / Oversold zone:

🔶 TECHNIQUES
🔹 I. Make a User Defined Type (UDT) Flare, with:
· 5x linefill[] - array of linefill
· int iDir, which captures the direction (current location of close in Flare)
· color cCol, this is a colour variable in relation to the direction.
🔹 II. Different functions will add a new Flare object, and update the values on each bar.
· Explanation of each function can be found in the script.
🔶 EXTRA's
· The input.color() is located in the function set_flare_B(flare obj)
· Best to put the inputs at the beginning of the script, I included this alternative just to show it is possible (but mostly not ideal)
· Background colour (settings: Bgcolor) can be enabled for better visibility of colours
• Pine Script™ introduces methods (1, 2)! Much kuddos for the developers, Tradingview, and all who has worked on it!
• This educational script will show the simplified way of writing built-in methods, not to create a new method.
🔹 Simplified way of writing built-in methods:
· Instead of:
newArray = array.new<int>()
array.unshift(newArray, 1)
lin = line.new(na, na, na, na)
line.set_xy1(lin, bar_index , close)
line.set_xy2(lin, bar_index + 10, close)
label newLabel = label.new(bar_index, high)
if barstate.islast
label.delete(newLabel)
· We now can write it like this:
newArray = array.new<int>()
newArray.unshift(1)
lin = line.new(na, na, na, na)
lin.set_xy1(bar_index , close)
lin.set_xy2(bar_index + 10, close)
label newLabel = label.new(bar_index, high)
if barstate.islast
newLabel.delete()
——————————————————————————————————————————————————————————
· When using [1] sometimes brackets are necessary:
label lab = label.new(bar_index, high)
if barstate.islast
label.set_color(lab, color.red)
label.delete(lab[1])
· ->
label lab = label.new(bar_index, high)
if barstate.islast
lab.set_color(color.red)
(lab[1]).delete() // lab[1].delete() doesn't compile at the moment
——————————————————————————————————————————————————————————
🔶 OVERVIEW OF SCRIPT
• The basic principles are:
· Find 1 point (close) x bars back from current bar (settings: 'x close back').
· Create a 'Flare' shaped object from that point to current bar or further (dependable of "Width of Flare").
· Calculate where current close is located versus the Flare lines.
· On that bases, change colour and draw plotshapes.
· Below bar if current close is located in the upper part of the Flare
· Above bar if current close is located in the lower part of the Flare
· Above & Below if located in the middle part of the Flare
-> Above & Below colours has 3 different colours (adjustable), dependable on the position
🔶 EXAMPLES
· Neutral zone:
· Light Bullish zone:
· Bullish zone:
· Very Bullish / Overbought zone:
· Light Bearish zone:
· Bearish zone:
· Very Bearish / Oversold zone:
🔶 TECHNIQUES
🔹 I. Make a User Defined Type (UDT) Flare, with:
· 5x linefill[] - array of linefill
· int iDir, which captures the direction (current location of close in Flare)
· color cCol, this is a colour variable in relation to the direction.
🔹 II. Different functions will add a new Flare object, and update the values on each bar.
· Explanation of each function can be found in the script.
🔶 EXTRA's
· The input.color() is located in the function set_flare_B(flare obj)
· Best to put the inputs at the beginning of the script, I included this alternative just to show it is possible (but mostly not ideal)
· Background colour (settings: Bgcolor) can be enabled for better visibility of colours
Script open-source
In pieno spirito TradingView, il creatore di questo script lo ha reso open-source, in modo che i trader possano esaminarlo e verificarne la funzionalità. Complimenti all'autore! Sebbene sia possibile utilizzarlo gratuitamente, ricorda che la ripubblicazione del codice è soggetta al nostro Regolamento.
Who are PineCoders?
tradingview.com/chart/SSP/yW5eOqtm-Who-are-PineCoders/
TG Pine Script® Q&A: t.me/PineCodersQA
- We cannot control our emotions,
but we can control our keyboard -
tradingview.com/chart/SSP/yW5eOqtm-Who-are-PineCoders/
TG Pine Script® Q&A: t.me/PineCodersQA
- We cannot control our emotions,
but we can control our keyboard -
Declinazione di responsabilità
Le informazioni ed i contenuti pubblicati non costituiscono in alcun modo una sollecitazione ad investire o ad operare nei mercati finanziari. Non sono inoltre fornite o supportate da TradingView. Maggiori dettagli nelle Condizioni d'uso.