OPEN-SOURCE SCRIPT
Rolling Net Volume
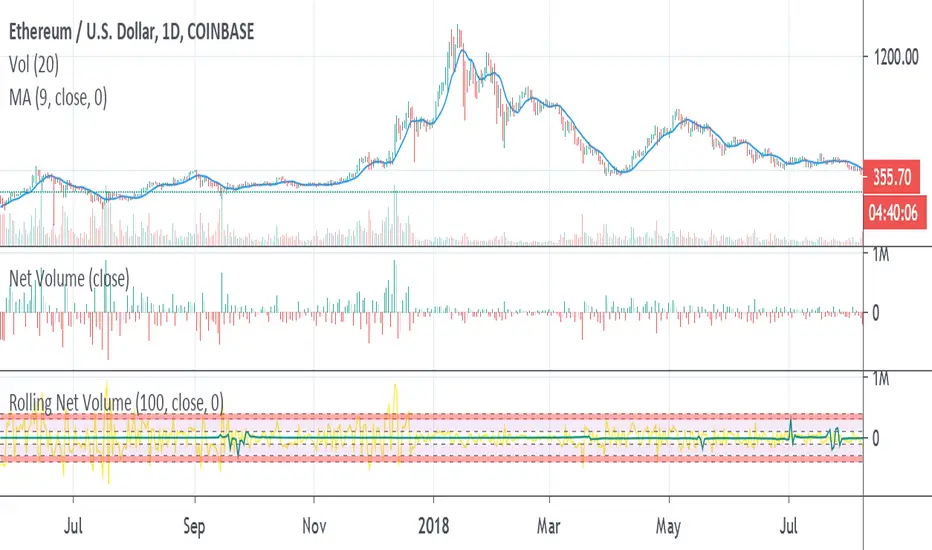
May still make changes, the current study should be helpful as is. Looking to highlight potential relative trend exhaustion in net volume. Should be most effective for stable supply assets. We're looking at an 100 day moving average of net volume essentially. The values of the RNV are slightly exaggerated to help with visibility PLEASE bear this in mind. Never the less, you can look at many commodities and notice moderate and extreme trend exhaustion on the positive and negative side using the transparent bands above and below. The less transparent red band perhaps suggests an opportunity to open a position against the current direction. It's not perfect, I may try to improve it. I am definitely open to feedback and appreciate it very much in advance.
Script open-source
In pieno spirito TradingView, il creatore di questo script lo ha reso open-source, in modo che i trader possano esaminarlo e verificarne la funzionalità. Complimenti all'autore! Sebbene sia possibile utilizzarlo gratuitamente, ricorda che la ripubblicazione del codice è soggetta al nostro Regolamento.
Declinazione di responsabilità
Le informazioni ed i contenuti pubblicati non costituiscono in alcun modo una sollecitazione ad investire o ad operare nei mercati finanziari. Non sono inoltre fornite o supportate da TradingView. Maggiori dettagli nelle Condizioni d'uso.