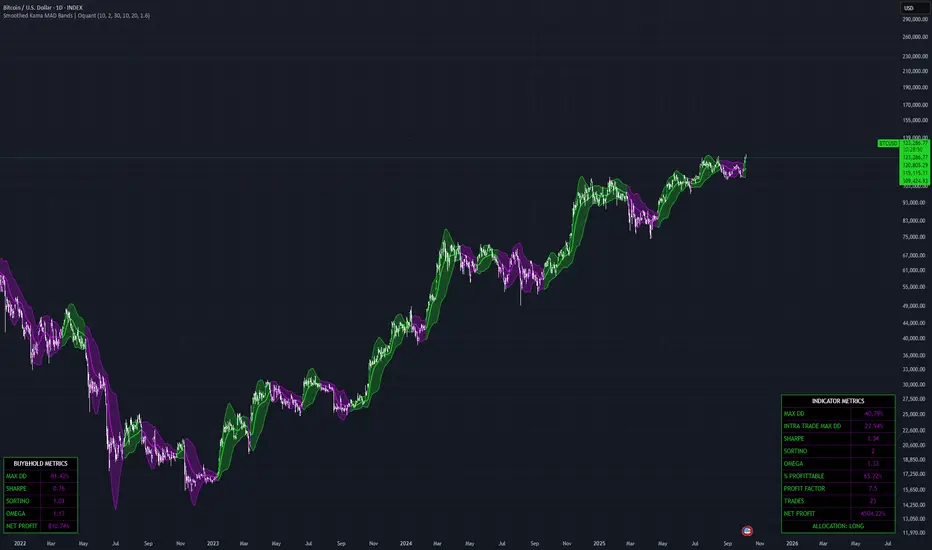
Smoothed Kama MAD Bands | Oquant
The Smoothed KAMA MAD Bands indicator is an tool designed to help traders identify potential trend directions while incorporating volatility-based boundaries. It builds on the Kaufman Adaptive Moving Average (KAMA) concept by adding a smoothing layer and pairing it with Mean Absolute Deviation (MAD) bands to create dynamic bands. This combination aims to filter noise in ranging markets and highlight momentum shifts, with built-in position signals for long or short allocations. Additionally, it calculates key performance metrics to compare the indicator's historical behavior against a simple buy-and-hold approach(Remember past performance doesn’t guarantee future results).
Key Factors/Components
Smoothed KAMA: An adaptive moving average that adjusts its sensitivity based on market efficiency, smoothed further to reduce whipsaws.
MAD Bands: Volatility bands derived from the mean absolute deviation, multiplied by a user-defined factor to set upper and lower boundaries around the smoothed KAMA.
Position Allocation: Generates long (above upper band) or short (below lower band) signals, with options to disable longs or shorts to default to cash.
Built-in Alerts: Set Alerts for bullish(price above upper band) and bearish(price below lower band) signals.
Performance Metrics: Includes tables displaying metrics like maximum drawdown, intra-trade max drawdown, Sharpe ratio, Sortino ratio, Omega ratio, percent profitable, profit factor, total trades, and net profit for the indicator's equity curve. A separate table shows buy-and-hold metrics for the underlying asset(Remember past performance doesn’t guarantee future results).
Equity Curve Plot: Optional plotting of the strategy's simulated equity curve for visual assessment.
How It Works
The core logic starts by calculating an efficiency ratio to determine market trendiness versus choppiness, which informs the adaptive speed of the KAMA. This KAMA is then smoothed using an exponential moving average to enhance stability. Separately, MAD(mean absolute deviation) is computed, then scaled by a multiplier to form bands around the smoothed KAMA. Crosses above the upper band suggest upward momentum (long allocation), while crosses below the lower band indicate downward momentum (short allocation). Metrics are derived from a simulated equity curve based on these allocations, tracking returns, risks, and efficiency ratios over the specified period(Remember past performance doesn’t guarantee future results).
For Who It Is Best/Recommended Use Cases
This indicator is best suited for trend-following traders or those managing strategies on crypto markets. It's recommended for users who want to evaluate trend signals with volatility-adjusted bands and backtest metrics to inform their decision-making process(Remember past performance doesn’t guarantee future results). Ideal for traders comfortable with adaptive averages, particularly in markets where noise reduction can help avoid false signals.
Settings and Default Settings
Start Date: Defines the beginning of the calculation period and backtest metrics (default: 1 Jan 2018).
Efficiency Length: Period for efficiency ratio calculation (default: 10).
KAMA Fast Length: Shorter period for adaptive calculation (default: 2).
KAMA Slow Length: Longer period for adaptive calculation (default: 30).
KAMA Smoothing Length: Smoothing period for the final KAMA (default: 10).
MAD Length: Period for mean absolute deviation (default: 20).
Band Multiplier: Scaling factor for bands (default: 1.6).
Allow Long Trades: Enables/disables long positions (default: true).
Allow Shorts: Enables/disables short positions (default: false).
Show Indicator Metrics Table: Displays performance table (default: true).
Show Buy&Hold Table: Displays asset benchmark table (default: true).
Plot Equity Curve: Shows simulated equity line (default: false).
These defaults are tuned for general use on daily charts but should be adjusted based on the asset and timeframe.
Conclusion
By integrating a smoothed adaptive moving average with deviation-based bands and comprehensive metrics, this indicator offers a structured way to assess trends and historical performance(Remember past performance doesn’t guarantee future results). It encourages informed trading by highlighting both signals and risk factors(Remember past performance doesn’t guarantee future results), helping users align it with their strategies.
⚠️ Disclaimer: This indicator is intended for educational and informational purposes only. Trading/investing involves risk, and past performance does not guarantee future results. Always test and evaluate indicators/strategies before applying them in live markets. Use at your own risk.
Script su invito
Solo gli utenti approvati dall'autore possono accedere a questo script. È necessario richiedere e ottenere l'autorizzazione per utilizzarlo. Tale autorizzazione viene solitamente concessa dopo il pagamento. Per ulteriori dettagli, seguire le istruzioni dell'autore riportate di seguito o contattare direttamente oquant.
TradingView NON consiglia di pagare o utilizzare uno script a meno che non ci si fidi pienamente del suo autore e non si comprenda il suo funzionamento. Puoi anche trovare alternative gratuite e open-source nei nostri script della comunità.
Istruzioni dell'autore
oquantsystems.com
Declinazione di responsabilità
Script su invito
Solo gli utenti approvati dall'autore possono accedere a questo script. È necessario richiedere e ottenere l'autorizzazione per utilizzarlo. Tale autorizzazione viene solitamente concessa dopo il pagamento. Per ulteriori dettagli, seguire le istruzioni dell'autore riportate di seguito o contattare direttamente oquant.
TradingView NON consiglia di pagare o utilizzare uno script a meno che non ci si fidi pienamente del suo autore e non si comprenda il suo funzionamento. Puoi anche trovare alternative gratuite e open-source nei nostri script della comunità.
Istruzioni dell'autore
oquantsystems.com