OPEN-SOURCE SCRIPT
Aggiornato ADR, ATR & VOL Overlay
This is a combined version of 2 of my other indicators:
ADR / ATR Overlay
VOL / AVG Overlay
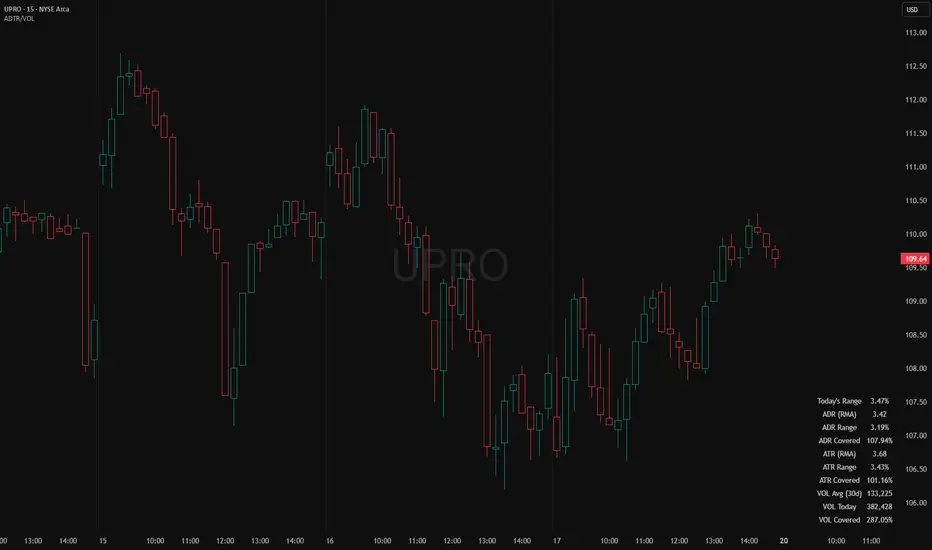
This indicator will display the following as an overlay on your chart:
Description:
Options:
ADR/ATR:
Volume:
Table:
ADR / ATR Example:
The ADR and ATR can be used to provide information about average price moves to help set targets, stop losses, entries and exits based on the potential average moves.
Example: If the "% of ADR" is reading 100%, then 100% of the asset's average price range has been covered, suggesting that an additional move beyond the range has a lower probability.
Example: "ADR % of Price" provides potential price movement in percentage which can be used to asses R/R for asset.
Example: ADR (D) reading is 100% at market close but ATR (D) is at 70% at close. This suggests that there is a potential (coverage) move of 30% in Pre/Post market as suggested by averages.
Custom Volume Session Example:
Set indicator to 30 period average. Set custom time frame to 9:30am to 10:30am Eastern/New York.
When the time frame for the calculation is closed, the indicator will provide a comparison of the current days volume compared to the average of 30 previous days for that same time frame and display it as a percentage in the table.
In this example you could compare how the first hour of the trading day compares to the previous 30 day's average, aiding in evaluating the potential volume for the remainder of the day.
Notes:
Times must be entered in 24 hour format. (1pm = 13:00 etc.)
Volume indicator is for Intra-day time frames, not > Day.
How I use these values:
I use these calculations to determine if a ticker symbol has the necessary range to achieve target gains, to determine if the price oscillation is within "normal" ranges to determine if the trading day will be choppy, and to determine placement of stops and targets within average ranges in combination with support, resistance and retracement levels.
ADR / ATR Overlay
VOL / AVG Overlay
This indicator will display the following as an overlay on your chart:
- ADR
- % of ADR
- ADR % of Price
- ATR
- % of ATR
- ATR % of Price
- Custom Session Volume
- Average For Selected Session
- Volume Percentage Comparison
Description:
- ADR : Average Day Range
- % of ADR : Percentage that the current price move has covered its average.
- ADR % of Price : The percentage move implied by the average range.
- ATR : Average True Range
- % of ATR : Percentage that the current price move has covered its average.
- ATR % of Price : The percentage move implied by the average true range.
- Custom Session Volume : User chosen time frame to monitor volume
- Average For Selected Session : Average for the custom session volume
- Volume Percentage Comparison : Current session compared to the average (calculated at session close)
Options:
ADR/ATR:
- Time Frame
- Length
- Smoothing
Volume:
- Set Custom Time Frame For Calculations
- Set Custom Time Frame For Average Comparison
- Set Custom Time Zone
Table:
- Enable / Disable Each Value
- Change Text Color
- Change Background Color
- Change Table location
- Add/Remove extra row for placement
ADR / ATR Example:
The ADR and ATR can be used to provide information about average price moves to help set targets, stop losses, entries and exits based on the potential average moves.
Example: If the "% of ADR" is reading 100%, then 100% of the asset's average price range has been covered, suggesting that an additional move beyond the range has a lower probability.
Example: "ADR % of Price" provides potential price movement in percentage which can be used to asses R/R for asset.
Example: ADR (D) reading is 100% at market close but ATR (D) is at 70% at close. This suggests that there is a potential (coverage) move of 30% in Pre/Post market as suggested by averages.
Custom Volume Session Example:
Set indicator to 30 period average. Set custom time frame to 9:30am to 10:30am Eastern/New York.
When the time frame for the calculation is closed, the indicator will provide a comparison of the current days volume compared to the average of 30 previous days for that same time frame and display it as a percentage in the table.
In this example you could compare how the first hour of the trading day compares to the previous 30 day's average, aiding in evaluating the potential volume for the remainder of the day.
Notes:
Times must be entered in 24 hour format. (1pm = 13:00 etc.)
Volume indicator is for Intra-day time frames, not > Day.
How I use these values:
I use these calculations to determine if a ticker symbol has the necessary range to achieve target gains, to determine if the price oscillation is within "normal" ranges to determine if the trading day will be choppy, and to determine placement of stops and targets within average ranges in combination with support, resistance and retracement levels.
Note di rilascio
changed tag to "% of VOL"Note di rilascio
Added calculations for current day's ADR and ATR in %Modified table labels and settings labels for clarity
Note di rilascio
Changed the "range" settings/calculation which didn't make sense. The option now shows "days range" expressed as a percentage of High-Low/Open so that it can be used as a comparison to the ADR % move and ATR % move for the given day or period.
Note di rilascio
typosNote di rilascio
Added row to table to track current VIX levelAdded position options for table placement
Note di rilascio
Added VIX Daily Change % Row to table.Script open-source
Nello spirito di TradingView, l'autore di questo script lo ha reso open source, in modo che i trader possano esaminarne e verificarne la funzionalità. Complimenti all'autore! Sebbene sia possibile utilizzarlo gratuitamente, ricordiamo che la ripubblicazione del codice è soggetta al nostro Regolamento.
Declinazione di responsabilità
Le informazioni e le pubblicazioni non sono intese come, e non costituiscono, consulenza o raccomandazioni finanziarie, di investimento, di trading o di altro tipo fornite o approvate da TradingView. Per ulteriori informazioni, consultare i Termini di utilizzo.
Script open-source
Nello spirito di TradingView, l'autore di questo script lo ha reso open source, in modo che i trader possano esaminarne e verificarne la funzionalità. Complimenti all'autore! Sebbene sia possibile utilizzarlo gratuitamente, ricordiamo che la ripubblicazione del codice è soggetta al nostro Regolamento.
Declinazione di responsabilità
Le informazioni e le pubblicazioni non sono intese come, e non costituiscono, consulenza o raccomandazioni finanziarie, di investimento, di trading o di altro tipo fornite o approvate da TradingView. Per ulteriori informazioni, consultare i Termini di utilizzo.