PROTECTED SOURCE SCRIPT
Aggiornato EMA Trend Suite
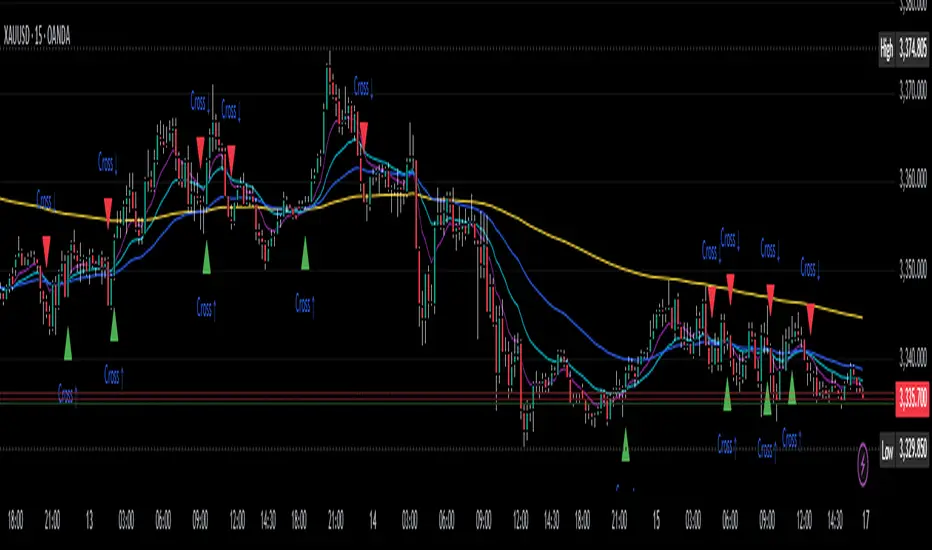
The EMA Trend Suite is a trend-following tool built around a stack of four Exponential Moving Averages (EMAs): 9, 21, 51, and 200. It is designed to help traders quickly identify market bias, potential support/resistance zones, and directional momentum.
🔹 How it works:
EMA 200 – The Trend Boss
Price trading above EMA 200 → bullish bias is prioritized.
Price trading below EMA 200 → bearish bias is prioritized.
EMA 51 & EMA 21 – Dynamic Support & Resistance
These mid-range EMAs behave as adaptive support and resistance.
In bullish bias, pullbacks often respect EMA 21 or EMA 51.
In bearish bias, rallies often fail at EMA 21 or EMA 51.
EMA 9 – The Momentum Guide
The fastest EMA tracks short-term direction.
A clean break and hold beyond EMA 9 signals short-term momentum continuation.
EMA 9 crossing EMA 21 often signals the next move within the bias.
🔹 How to Trade It:
Identify the bias with EMA 200
Above EMA 200 = bullish bias.
Below EMA 200 = bearish bias.
Look for the trigger
In bullish bias: wait until EMA 9 crosses above EMA 21 → potential long signal.
In bearish bias: wait until EMA 9 crosses below EMA 21 → potential short signal.
Manage the trade with EMA 21 & 51
Price often bounces off EMA 21 and EMA 51.
In longs: if price starts closing below EMA 51, it’s often a warning to consider closing or reducing risk.
In shorts: if price starts closing above EMA 51, same idea — momentum might be weakening.
Ride momentum, don’t marry the trade
Sometimes price keeps trending strongly even after a close beyond EMA 51, but often it’s a sign of exhaustion. The suite is best used as a trend filter + timing tool, not a guaranteed entry/exit system.
🔹 Best Timeframes:
Gold, NAS100, US30, S&P500: Best results between 15M, 30M, and 1H.
Currency pairs (Forex): Best results on 1H, 4H, and Daily.
⚠️ Important Disclaimer:
This indicator is not a one-stop shop solution for trading.
It is not reliable in consolidations — EMA crossings can create false signals in sideways markets.
Always combine with other tools like candlestick patterns, market structure, or volume analysis.It should be seen as a guide to bias and momentum, not as a trading bot or automated strategy.
Note di rilascio
The EMA Trend Suite is a trend-following tool built around a stack of four Exponential Moving Averages (EMAs): 9, 21, 51, and 200. It is designed to help traders quickly identify market bias, potential support/resistance zones, and directional momentum.🔹 How it works:
EMA 200 – The Trend Boss
Price trading above EMA 200 → bullish bias is prioritized.
Price trading below EMA 200 → bearish bias is prioritized.
EMA 51 & EMA 21 – Dynamic Support & Resistance
These mid-range EMAs behave as adaptive support and resistance.
In bullish bias, pullbacks often respect EMA 21 or EMA 51.
In bearish bias, rallies often fail at EMA 21 or EMA 51.
EMA 9 – The Momentum Guide
The fastest EMA tracks short-term direction.
A clean break and hold beyond EMA 9 signals short-term momentum continuation.
EMA 9 crossing EMA 21 often signals the next move within the bias.
🔹 How to Trade It:
Identify the bias with EMA 200
Above EMA 200 = bullish bias.
Below EMA 200 = bearish bias.
Look for the trigger
In bullish bias: wait until EMA 9 crosses above EMA 21 → potential long signal.
In bearish bias: wait until EMA 9 crosses below EMA 21 → potential short signal.
Manage the trade with EMA 21 & 51
Price often bounces off EMA 21 and EMA 51.
In longs: if price starts closing below EMA 51, it’s often a warning to consider closing or reducing risk.
In shorts: if price starts closing above EMA 51, same idea — momentum might be weakening.
Ride momentum, don’t marry the trade
Sometimes price keeps trending strongly even after a close beyond EMA 51, but often it’s a sign of exhaustion. The suite is best used as a trend filter + timing tool, not a guaranteed entry/exit system.
🔹 Best Timeframes:
Gold, NAS100, US30, S&P500: Best results between 15M, 30M, and 1H.
Currency pairs (Forex): Best results on 1H, 4H, and Daily.
⚠️ Important Disclaimer:
This indicator is not a one-stop shop solution for trading.
It is not reliable in consolidations — EMA crossings can create false signals in sideways markets.
Always combine with other tools like candlestick patterns, market structure, or volume analysis.It should be seen as a guide to bias and momentum, not as a trading bot or automated strategy.
Script protetto
Questo script è pubblicato come codice protetto. Tuttavia, è possibile utilizzarle liberamente e senza alcuna limitazione – ulteriori informazioni qui.
Declinazione di responsabilità
Le informazioni e le pubblicazioni non sono intese come, e non costituiscono, consulenza o raccomandazioni finanziarie, di investimento, di trading o di altro tipo fornite o approvate da TradingView. Per ulteriori informazioni, consultare i Termini di utilizzo.