BRAHMA - Better Remodelled Adaptive Holistic Moving Average
===================================================================================================================
™𝗧𝗿𝗮𝗱𝗲𝗖𝗵𝗮𝗿𝘁𝗶𝘀𝘁 𝗕𝗥𝗔𝗛𝗠𝗔 𝗨𝘀𝗲𝗿 𝗠𝗮𝗻𝘂𝗮𝗹
=====================================
Like any other moving average system, the source price and the lookback length determines the dynamic of BRAHMA. Source price can be selected from Sᴏᴜʀᴄᴇ dropdown and the lookback length can be enetered in the Bʀᴀʜᴍᴀ Lᴇɴɢᴛʜ input box. MA ᴛʏᴘᴇ dropdown is used to choose the type of moving average for BRAHMA to adapt to. To use the source price directly, Use Source must be selected from the dropdown.
In addition to this usual requirement, Bʀᴀʜᴍᴀ Wɪᴅᴛʜ and Bʀᴀʜᴍᴀ Sᴛᴇᴘ Lᴇɴɢᴛʜ are required to make BRAHMA moving average system complete, based on risk and reward expectations of the user.
===================================================================================================================
BRAHMA Bands and Steps
The Bands and the Steps are integral part of the BRAHMA system. When the Bʀᴀʜᴍᴀ Wɪᴅᴛʜ and Bʀᴀʜᴍᴀ Sᴛᴇᴘ Lᴇɴɢᴛʜ values are 1, the bands and steps lie dormant inside BRAHMA and they emanate from the main plot as the values are increased.
Bʀᴀʜᴍᴀ Wɪᴅᴛʜ impacts the Bands Mean line + expands or contracts the bands and Bʀᴀʜᴍᴀ Sᴛᴇᴘ Lᴇɴɢᴛʜ transforms the dormant step system (on minimum value of 1) from inside the BRAHMA bands into a powerful step/block like structure that helps find support/resistance levels and displays Bull and Bear zones based on price action in relation to the BRAHMA bands and BRAHMA steps.
Dɪsᴘʟᴀʏ Bʀᴀʜᴍᴀ Sᴛᴇᴘs plots the steps
Dɪsᴘʟᴀʏ Bʀᴀʜᴍᴀ Bᴀɴᴅs plots the bands
Enabling Cᴏʟᴏᴜʀ Bᴀʀs with Bands and Steps displayed will plot the Bull and Bear Zones on price bars and this dynamic is very different from the colouring of the bars based on the cloud as a standalone plot.
===================================================================================================================
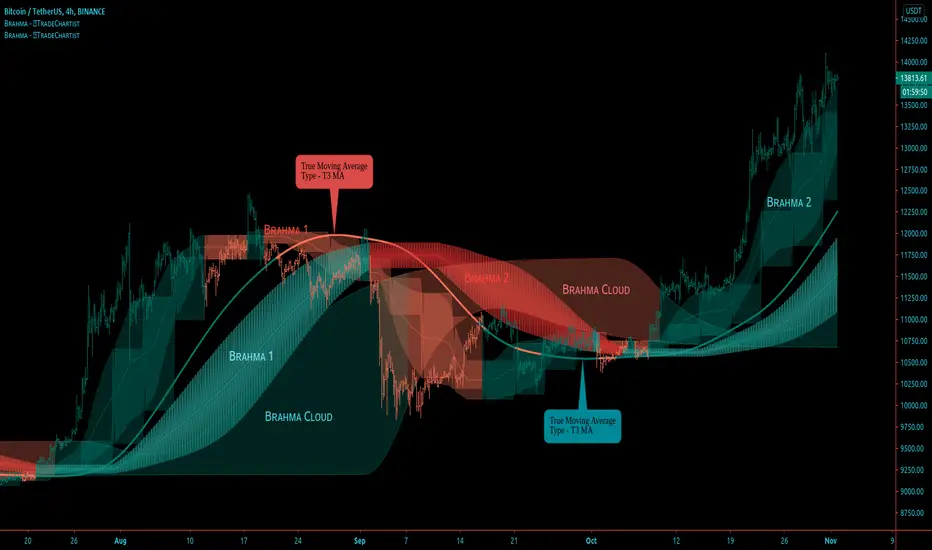
BRAHMA Cloud
The cloud is a very useful part of this system and helps see the price action with the help of volatility of Bulls/Bears based on the lookback length, step length and the cloud factor. Price above or below the cloud helps visualize the strength of the trend along with the height/thickness of the cloud. Thinning of the cloud can signal reversals and can be used with another confirmator.
Cʟᴏᴜᴅ Fᴀᴄᴛᴏʀ (1 - 10) affects the cloud dynamic and can be changed to suit personal risk strategy and trade frequency. Cloud sensitivity is also affected by the Bʀᴀʜᴍᴀ Lᴇɴɢᴛʜ. Cloud can be used on its own with really low lookback length (even length of 1 works well).
Dɪsᴘʟᴀʏ Bʀᴀʜᴍᴀ Cʟᴏᴜᴅ plots the cloud
Enabling Bʀᴀʜᴍᴀ Cᴏʟᴏᴜʀ Bᴀʀs with Cloud displayed as the only standalone component of the indicator will plot the Bull and Bear Zones and this dynamic is very different from the colouring of the bars based on the Bands and Steps on chart. When the price enters the cloud from below after or during a period of downtrend will start painting Bull colour and when the price enters the cloud from above after or during a period of uptrend will start painting Bear colour on the price bars.
===================================================================================================================
BRAHMA Colour Scheme
The colours of the plots and fills can be changed based on user preference from the indicator settings.
There are three Themes to choose from Bʀᴀʜᴍᴀ Cᴏʟᴏᴜʀ Bᴀʀs Tʜᴇᴍᴇ (Simple, Chilli and Flame) dropdown to colour the price bars.
Enabling Bʀᴀʜᴍᴀ Cᴏʟᴏᴜʀ Bᴀʀs with Simple Theme colours the price bars based on Bull and Bear zones as explained in the sections above. Chilli and Flame themes colour the price bars with trend intensity for every bar based on the source price and lookback length.
===================================================================================================================
Alerts
Alerts can be created for Long and Short entries by using Once Per Bar Close as Alert Frequency. Entries are generated on Real time bars. It is recommended to wait for bar close before taking a position based on Trade Entries.
The indicator does not repaint and can be confidently used for alerts and trade entries without worrying about signals disappearing.
™TradeChartist BRAHMA can also be connected to ™TradeChartist Plug and Trade using 𝗕𝗥𝗔𝗛𝗠𝗔 𝗧𝗿𝗲𝗻𝗱 𝗜𝗱𝗲𝗻𝘁𝗶𝗳𝗶𝗲𝗿 as Oscillatory Signal to generate entries along with Targets, Stop Loss plots etc. Target and Stop Loss alerts can be created using Plug and Trade's Alerts system.
===================================================================================================================
Example Charts
1. The 15m chart below demonstrates how a Simple Moving Average can be transformed from a noisy pretty much untradeable MA plot to meaningful Moving Average Trade System using BRAHMA by adjusting the Width and the Step Length.
2. GBP-USD 1hr chart using 34 period Zero-Lag EMA with 21 width and 24 step length (24 hrs in a Daily candle - This helps choose length for HTF based levels)
3. NIFTY 1hr chart using 21 period TEMA (Triple Exponential MA) with 21 width and 24 step length.
4. XAU-USD Daily chart using 89 period TEMA with 24 width and 12 step length, enabling Chilli Theme based colour bars.
5. LINK-USDT 1hr chart using 21 period Hull MA with 24 width, 24 step length and cloud factor of 2 visualised using colour bars on cloud as standalone plot.
===================================================================================================================
Best Practice: Test with different settings first using Paper Trades before trading with real money
===================================================================================================================
This is not a free to use indicator. Get in touch with me (PM me directly if you would like trial access to test the indicator)
Premium Scripts - Trial access and Information
Trial access offered on all Premium scripts.
PM me directly to request trial access to the scripts or for more information.
===================================================================================================================
Script su invito
Solo gli utenti approvati dall'autore possono accedere a questo script. È necessario richiedere e ottenere l'autorizzazione per utilizzarlo. Tale autorizzazione viene solitamente concessa dopo il pagamento. Per ulteriori dettagli, seguire le istruzioni dell'autore riportate di seguito o contattare direttamente TradeChartist.
TradingView NON consiglia di acquistare o utilizzare uno script a meno che non si abbia piena fiducia nel suo autore e se ne comprenda il funzionamento. È inoltre possibile trovare alternative gratuite e open source nei nostri script della community.
Istruzioni dell'autore
Telegram - @Trade_Chartist
Free Scripts - bit.ly/Free-Scripts
Declinazione di responsabilità
Script su invito
Solo gli utenti approvati dall'autore possono accedere a questo script. È necessario richiedere e ottenere l'autorizzazione per utilizzarlo. Tale autorizzazione viene solitamente concessa dopo il pagamento. Per ulteriori dettagli, seguire le istruzioni dell'autore riportate di seguito o contattare direttamente TradeChartist.
TradingView NON consiglia di acquistare o utilizzare uno script a meno che non si abbia piena fiducia nel suo autore e se ne comprenda il funzionamento. È inoltre possibile trovare alternative gratuite e open source nei nostri script della community.
Istruzioni dell'autore
Telegram - @Trade_Chartist
Free Scripts - bit.ly/Free-Scripts