OPEN-SOURCE SCRIPT
Volume Flow with Bollinger Bands and EMA Cross Signals
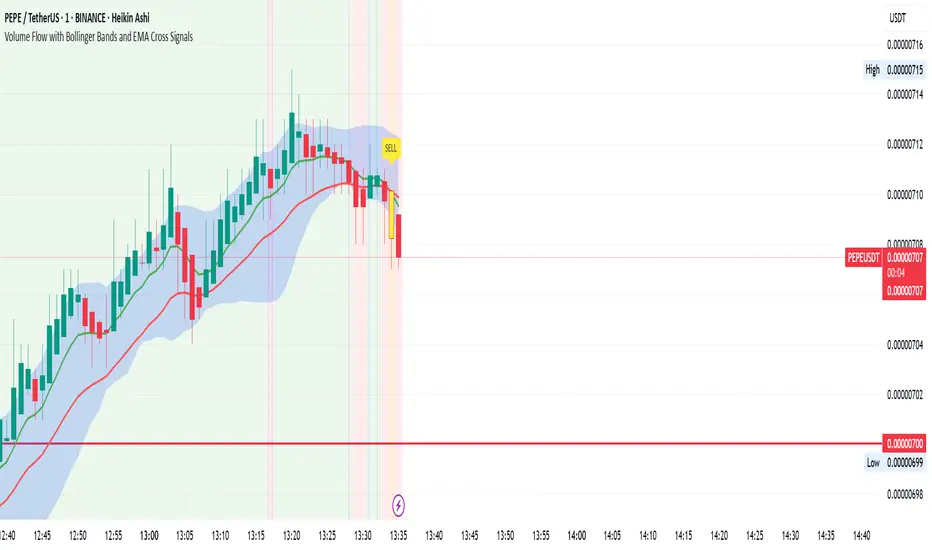
The Volume Flow with Bollinger Bands and EMA Cross Signals indicator is a custom technical analysis tool designed to identify potential buy and sell signals based on several key components:
Volume Flow: This component combines price movement and trading volume to create a signal that indicates the strength or weakness of price movements. When the price is rising with increasing volume, it suggests strong buying activity, whereas falling prices with increasing volume indicate strong selling pressure.
Bollinger Bands: Bollinger Bands consist of three lines:
The Basis (middle line), which is a Simple Moving Average (SMA) of the price over a set period.
The Upper Band, which is the Basis plus a multiple of the standard deviation (typically 2).
The Lower Band, which is the Basis minus a multiple of the standard deviation. Bollinger Bands help identify periods of high volatility and potential overbought/oversold conditions. When the price touches the upper band, it might indicate that the market is overbought, while touching the lower band might indicate oversold conditions.
EMA Crossovers: The script includes two Exponential Moving Averages (EMAs):
Fast EMA: A shorter-term EMA, typically more sensitive to price changes.
Slow EMA: A longer-term EMA, responding slower to price changes. The crossover of the Fast EMA crossing above the Slow EMA (bullish crossover) signals a potential buy opportunity, while the Fast EMA crossing below the Slow EMA (bearish crossover) signals a potential sell opportunity.
Background Color and Candle Color: The indicator highlights the chart's background with specific colors based on the signals:
Green background for buy signals.
Yellow background for sell signals. Additionally, the candles are colored green for buy signals and yellow for sell signals to visually reinforce the trade opportunities.
Buy/Sell Labels: Small labels are placed on the chart:
"BUY" label in green is placed below the bar when a buy signal is generated.
"SELL" label in yellow is placed above the bar when a sell signal is generated.
Working of the Indicator:
Volume Flow Calculation: The Volume Flow is calculated by multiplying the price change (current close minus the previous close) with the volume. This product is then smoothed with a Simple Moving Average (SMA) over a user-defined period (length). The result is then multiplied by a multiplier to adjust its sensitivity.
Price Change = close - close[1]
Volume Flow = Price Change * Volume
Smoothed Volume Flow = SMA(Volume Flow, length)
The Volume Flow Signal is then: Smooth Volume Flow * Multiplier
This calculation represents the buying or selling pressure in the market.
Bollinger Bands: Bollinger Bands are calculated using the Simple Moving Average (SMA) of the closing price (basis) and the Standard Deviation (stdev) of the price over a period defined by the user (bb_length).
Basis (Middle Band) = SMA(close, bb_length)
Upper Band = Basis + (bb_std_dev * Stdev)
Lower Band = Basis - (bb_std_dev * Stdev)
The upper and lower bands are plotted alongside the price to identify the price's volatility. When the price is near the upper band, it could be overbought, and near the lower band, it could be oversold.
EMA Crossovers: The Fast EMA and Slow EMA are calculated using the Exponential Moving Average (EMA) function. The crossovers are detected by checking:
Buy Signal (Bullish Crossover): When the Fast EMA crosses above the Slow EMA.
Sell Signal (Bearish Crossover): When the Fast EMA crosses below the Slow EMA.
The long_condition variable checks if the Fast EMA crosses above the Slow EMA, and the short_condition checks if it crosses below.
Visual Signals:
Background Color: The background is colored green for a buy signal and yellow for a sell signal. This gives an immediate visual cue to the trader.
Bar Color: The candles are colored green for buy signals and yellow for sell signals.
Labels:
A "BUY" label in green appears below the bar when the Fast EMA crosses above the Slow EMA.
A "SELL" label in yellow appears above the bar when the Fast EMA crosses below the Slow EMA.
Summary of Buy/Sell Logic:
Buy Signal:
The Fast EMA crosses above the Slow EMA (bullish crossover).
Volume flow is positive, indicating buying pressure.
Background turns green and candles are colored green.
A "BUY" label appears below the bar.
Sell Signal:
The Fast EMA crosses below the Slow EMA (bearish crossover).
Volume flow is negative, indicating selling pressure.
Background turns yellow and candles are colored yellow.
A "SELL" label appears above the bar.
Usage of the Indicator:
This indicator is designed to help traders identify potential entry (buy) and exit (sell) points based on:
The interaction of Exponential Moving Averages (EMAs).
The strength and direction of Volume Flow.
Price volatility using Bollinger Bands.
By combining these components, the indicator provides a comprehensive view of market conditions, helping traders make informed decisions on when to enter and exit trades.
Script open-source
Nello spirito di TradingView, l'autore di questo script lo ha reso open source, in modo che i trader possano esaminarne e verificarne la funzionalità. Complimenti all'autore! Sebbene sia possibile utilizzarlo gratuitamente, ricordiamo che la ripubblicazione del codice è soggetta al nostro Regolamento.
Declinazione di responsabilità
Le informazioni e le pubblicazioni non sono intese come, e non costituiscono, consulenza o raccomandazioni finanziarie, di investimento, di trading o di altro tipo fornite o approvate da TradingView. Per ulteriori informazioni, consultare i Termini di utilizzo.