OPEN-SOURCE SCRIPT
Hancock - WAE
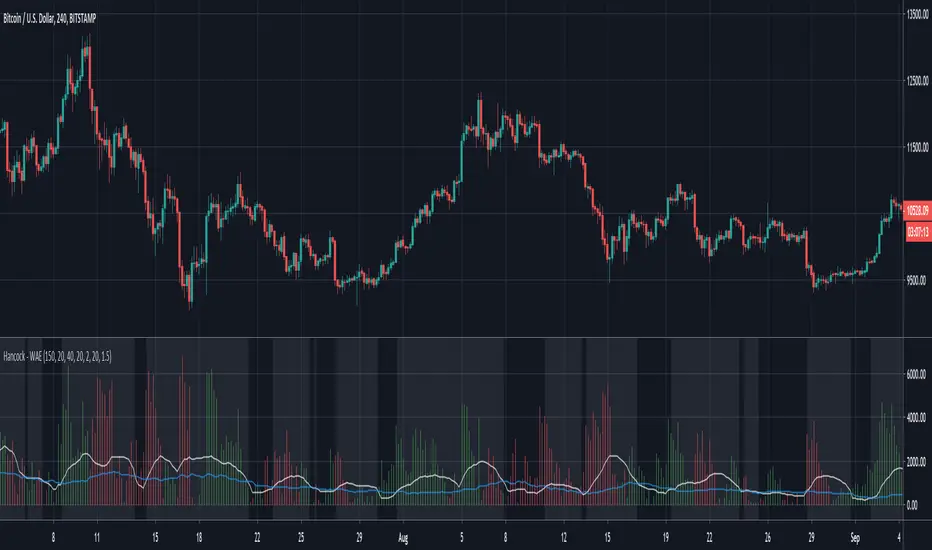
This is a version of the LazyBear Waddah Attar Explosion indicator that incorporates the LazyBear Squeeze Momentum Indicator. Full credit goes to LazyBear for this and i've added links to his indicators used for a further explanation.
This histogram is a plot of the difference between the current and previous MACD multiplier by the sensitivity value. Green indicates an up trend and red indicates a down trend.
The white line is the lower BB subtracted from the upper BB and signals should be taken when the histogram is greater than this line.
The blue line is taken from the Squeeze Indicator and is the Keltner Channel. If the white line is less than the blue line it can be considered a squeeze and the background color of the indicator is coloured to indicate when not in a squeeze.
Happy trading folks!
Hancock
Script open-source
In pieno spirito TradingView, il creatore di questo script lo ha reso open-source, in modo che i trader possano esaminarlo e verificarne la funzionalità. Complimenti all'autore! Sebbene sia possibile utilizzarlo gratuitamente, ricorda che la ripubblicazione del codice è soggetta al nostro Regolamento.
Declinazione di responsabilità
Le informazioni ed i contenuti pubblicati non costituiscono in alcun modo una sollecitazione ad investire o ad operare nei mercati finanziari. Non sono inoltre fornite o supportate da TradingView. Maggiori dettagli nelle Condizioni d'uso.