OPEN-SOURCE SCRIPT
PEG Ratio
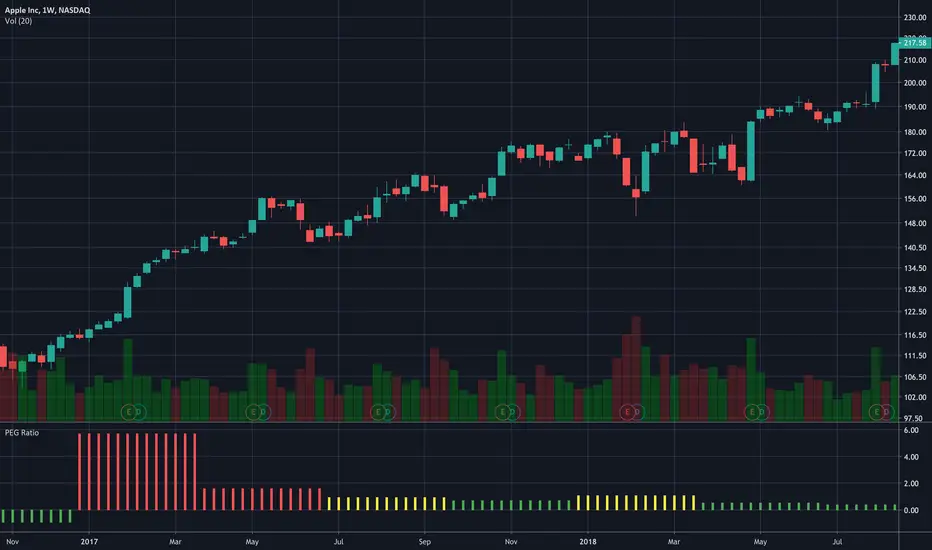
Hello everyone,
Quick script to check the PEG Ratio.
What is PEG Ratio?
The price/earnings to growth ratio (PEG Ratio) is a stock's price-to-earnings (P/E) ratio divided by the growth rate of its earnings for a specified time period. The PEG ratio is used to determine a stock's value while also factoring in the company's expected earnings growth, and is thought to provide a more complete picture than the more standard P/E ratio.
A PEG Ratio greater than 1.0 means that the stock is overvalued, while below 1.0 means is is undervalued. When the PEG Ratio is exactly 1.0, then the stock is trading at fair valuation.
Formula:
PEG Ratio = (Price / EPS) / EPS Growth
Examples:
Company A:
Company B
Company A
Company B
The company A is overvalued whiled the B is undervalued.
In this script an overvalued stock is considered when the PEG Ratio is above 1.1, while it is 0.9 for an undervalued stock.
Only works with Stocks.
Happy trading,
Quick script to check the PEG Ratio.
What is PEG Ratio?
The price/earnings to growth ratio (PEG Ratio) is a stock's price-to-earnings (P/E) ratio divided by the growth rate of its earnings for a specified time period. The PEG ratio is used to determine a stock's value while also factoring in the company's expected earnings growth, and is thought to provide a more complete picture than the more standard P/E ratio.
A PEG Ratio greater than 1.0 means that the stock is overvalued, while below 1.0 means is is undervalued. When the PEG Ratio is exactly 1.0, then the stock is trading at fair valuation.
Formula:
PEG Ratio = (Price / EPS) / EPS Growth
Examples:
Company A:
- Price per share = $46
- EPS this year = $2.09
- EPS last year = $1.74
Company B
- Price per share = $80
- EPS this year = $2.67
- EPS last year = $1.78
Company A
- P/E ratio = $46 / $2.09 = 22
- Earnings growth rate = ($2.09 / $1.74) - 1 = 20%
- PEG ratio = 22 / 20 = 1.1
Company B
- P/E ratio = $80 / $2.67 = 30
- Earnings growth rate = ($2.67 / $1.78) - 1 = 50%
- PEG ratio = 30 / 50 = 0.6
The company A is overvalued whiled the B is undervalued.
In this script an overvalued stock is considered when the PEG Ratio is above 1.1, while it is 0.9 for an undervalued stock.
Only works with Stocks.
Happy trading,
Script open-source
In pieno spirito TradingView, il creatore di questo script lo ha reso open-source, in modo che i trader possano esaminarlo e verificarne la funzionalità. Complimenti all'autore! Sebbene sia possibile utilizzarlo gratuitamente, ricorda che la ripubblicazione del codice è soggetta al nostro Regolamento.
Declinazione di responsabilità
Le informazioni ed i contenuti pubblicati non costituiscono in alcun modo una sollecitazione ad investire o ad operare nei mercati finanziari. Non sono inoltre fornite o supportate da TradingView. Maggiori dettagli nelle Condizioni d'uso.