PROTECTED SOURCE SCRIPT
Aggiornato 9 by 21(high & low) GSK-VIZAG-AP-INDIA
21 EMA High & Low + 9 EMA Crossover with Volume & Wick Confirmation
🔹 What Does This Indicator Do?
This indicator is designed for momentum-based trend trading by combining exponential moving averages (EMAs), price action filters, and volume analysis. It provides traders with high-probability buy and sell signals while filtering out weak trends and false breakouts.
🔹 How Is It Different from Other Indicators?
Unlike traditional EMA crossover strategies that rely only on moving averages, this indicator enhances reliability by incorporating custom volume conditions, price action validation, and wick-based filtering.
Key Features That Make It Unique:
Dynamic EMA Bands for Trend Identification
Uses 21 EMA High & 21 EMA Low as dynamic support & resistance levels, creating a flexible trading range.
Helps traders identify trend strength and potential reversals without relying on static levels.
Enhanced EMA Crossover System
Includes a 9 EMA crossover signal to detect momentum shifts before traditional EMAs react.
Avoids lagging signals often seen in standard moving average crossovers.
Smart Volume-Based Confirmation
Uses a custom volume multiplier to detect significant market participation.
Filters out low-volume breakouts that may lead to false signals.
Wick-Based Filtering for Precision
Identifies candles with no lower wick (for buy signals) and no upper wick (for sell signals) to confirm strong price movements.
Helps traders avoid weak reversals and focus only on strong momentum shifts.
🔹 How to Use This Indicator in Trading?
Buy Conditions:
Bullish candle (green) with no lower wick, confirming strong buying pressure.
Price is above the 21 EMA High and remains above 21 EMA Low.
Volume shows an increase, confirming market participation.
Sell Conditions:
Bearish candle (red) with no upper wick, signaling strong selling pressure.
Price is below the 21 EMA Low and remains under the 21 EMA High.
Volume confirms strong momentum in the downward direction.
Bonus: The indicator also highlights 9 EMA & 21 EMA crossovers to provideearly trend confirmations.
Who Should Use This Indicator?
✅ Intraday Traders – Looking for quick entry and exit signals based on price momentum.
✅ Swing Traders – Who want to identify medium-term trend shifts with volume confirmation.
✅ Trend Followers – Seeking a robust moving average system to avoid false breakouts.
✅ Momentum Traders – Who need price-action-based confirmation before taking a trade.
Why This Indicator Stands Out?
Unlike standard EMA-based indicators that often generate false breakouts, this tool:
✔️ Filters low-quality signals using smart volume analysis.
✔️ Enhances trend confirmation with wick-based filtering.
✔️ Detects momentum early using a unique EMA crossover combination.
This makes it more reliable than traditional moving average-based systems and highly adaptable for different market conditions.
Note: The logic behind this indicator is proprietary and non-repainting, making it a powerful tool for traders who rely on EMA-based trend strategies.
Try it out and see how it improves your trading decisions!
Why This Description Works?
✔ No code exposure – The logic is explained in concept but not in detail.
✔ Clear differentiation – Shows why this is better than other indicators.
✔ Compliant with TradingView rules – No vague claims, but precise explanations.
Would you like to add any specific trading examples or screenshots to further enhance it? Let me know!
Share Your Experience!
Your feedback is valuable! If you find this indicator useful, leave a comment with your experience—how it worked for you, any improvements you suggest, or the best settings you discovered.
Let’s build a community of traders refining strategies together!
Disclaimer:
This indicator is for educational and informational purposes only. It does not guarantee profitable trades and should be used with proper risk management. Always conduct your own research before making trading decisions.
Note di rilascio
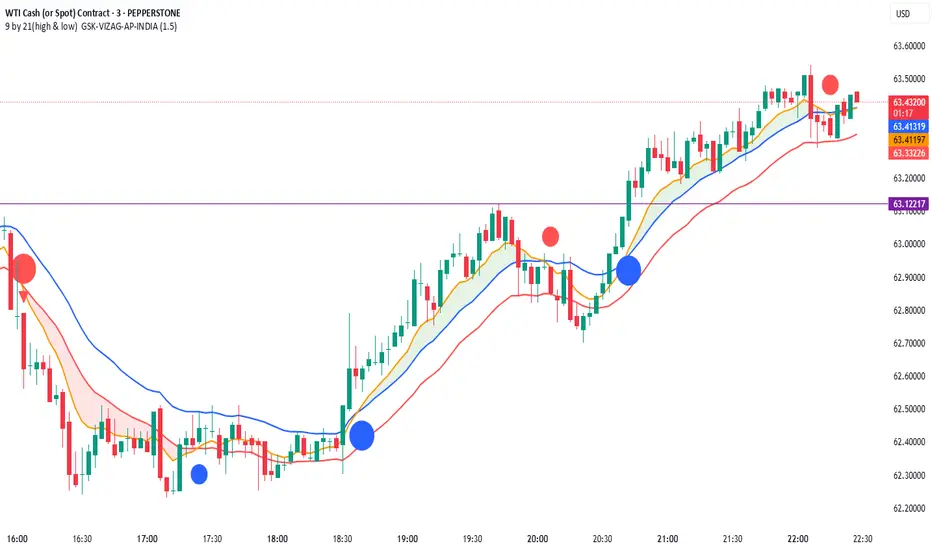
📈 9 EMA vs 21 EMA High/Low with Smart Volume & Crossover Signals – GSK-VIZAG-AP-INDIA🔧 About This Indicator
This advanced script is designed for trend-following and momentum traders. It combines Exponential Moving Averages (EMAs) with volume breakout conditions, wick filtering, and a unique zone crossover visualization system.
It helps traders identify:
Momentum continuation trades
Smart entry zones with volume confirmation
Visual guidance using crossover signals
⚙️ Core Features:
✅ EMA System
9 EMA: Fast-moving average for short-term trend
21 EMA High (Blue Line): Resistance guidance
21 EMA Low (Red Line): Support guidance
✅ Volume Confirmation
Only highlights candles with volume greater than the 20-period average multiplied by a user-defined factor (default = 1.5x).
✅ Candle Wick Filtering
Buy Signal: Bullish candle with no lower wick
Sell Signal: Bearish candle with no upper wick
(Helps filter out indecision candles or low conviction signals)
🎯 Buy & Sell Signals
Buy (🔼 Green Triangle): Bullish candle + No lower wick + Volume spike + Price above 21 EMA High and Low
Sell (🔽 Red Triangle): Bearish candle + No upper wick + Volume spike + Price below 21 EMA High and Low
🔵🔴 Crossover Signal Logic (EMA9 vs EMA21)
🔻 Bearish Crossovers:
🔴 Small Red Dot: When 9 EMA crosses below Blue Line (21 EMA High) → First sign of weakness
🔴 Big Red Dot: When 9 EMA crosses below Red Line (21 EMA Low) → Stronger bearish confirmation
🔺 Bullish Crossovers:
🔵 Small Blue Dot: When 9 EMA crosses above Red Line (21 EMA Low) → First sign of recovery
🔵 Big Blue Dot: When 9 EMA crosses above Blue Line (21 EMA High) → Strong bullish continuation
🎨 Visual Zone Highlights
Green Fill: When 9 EMA is above 21 EMA High (strong bullish zone)
Red Fill: When 9 EMA is below 21 EMA Low (strong bearish zone)
👨💻 Developed by:
GSK-VIZAG-AP-INDIA
🔐 Copyright © 2025
📌 For personal use only. Redistribution or reselling is prohibited.
⚠️ Disclaimer & Advisory Note
This indicator is designed for educational and informational purposes only. It does not constitute investment advice, trading recommendations, or a guarantee of future results. All trading decisions are solely the responsibility of the user.
Use this tool as part of your broader analysis and due diligence.
Past performance does not guarantee future outcomes.
The developer is not liable for any financial loss or damage arising from the use of this script.
This tool should not be interpreted as a signal service or financial advisory product.
Always consult with a certified financial advisor or your financial planner before making any trading or investment decisions.
By using this script, you acknowledge that you understand and agree to this disclaimer.
Script protetto
Questo script è pubblicato come codice protetto. Tuttavia, è possibile utilizzarle liberamente e senza alcuna limitazione – ulteriori informazioni qui.
"Created by GSK-VIZAG-AP-INDIA"
Declinazione di responsabilità
Le informazioni e le pubblicazioni non sono intese come, e non costituiscono, consulenza o raccomandazioni finanziarie, di investimento, di trading o di altro tipo fornite o approvate da TradingView. Per ulteriori informazioni, consultare i Termini di utilizzo.