PROTECTED SOURCE SCRIPT
Muzyorae - ICT Quarterly Theory (Intraday)
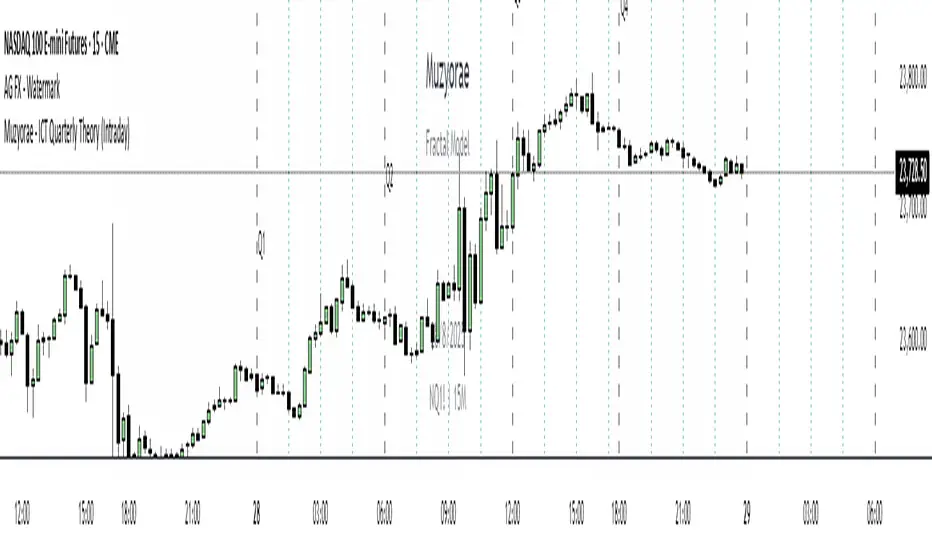
ICT Quarterly Theory — Intraday
What it is
ICT’s Quarterly Theory models the intraday session as repeating cycles of four “quarters.” On NY time, a trading day is split into four macro quarters of 6 hours each:
Q1: 00:00–06:00 NY (Asia / pre-London)
Q2: 06:00–12:00 NY (London–NY overlap, AM session)
Q3: 12:00–18:00 NY (Midday / PM session)
Q4: 18:00–24:00 NY (Asia re-open / late session)
Each macro quarter can be further subdivided into micro quarters of 90 minutes (q1–q4). This fractal view helps traders frame accumulation → expansion → distribution → liquidation phases and align executions with time-of-day liquidity.
Why it matters
Orderflow, liquidity raids, and displacement are highly time-dependent. Marking the quarters makes it easier to:
Anticipate when the market is likely to deliver the day’s expansion (often Q2) versus retracement/distribution (often Q3) or late liquidity runs (often Q4).
Compare today’s behavior to prior days within the same quarter windows.
Anchor bias, entries, and risk management to session-specific highs/lows rather than arbitrary clock times.
What this indicator shows
Macro quarters (6h): Vertical lines and optional labels (Q1–Q4) on NY time.
Micro quarters (90m): Optional finer verticals inside each macro quarter (q1–q4) for precise timing.
True Open (Q2 AM): Optional line at the AM session’s true open (default 06:00 NY) to study premium/discount development from the intraday benchmark.
Futures Sunday handling: Optional treatment of Sunday 18:00 NY as Q4 (useful for FX/futures).
Label controls: Choose above/below placement, offset, size, and colors; micro labels can be toggled independently.
Performance-friendly: De-duplicated labels and a look-back “days to show” setting keep charts clean.
How to use
Timeframe: Works on intraday charts (1–60m). 5–15m is a common balance of signal vs. noise.
Bias framing:
Map Asia (Q1), AM expansion (Q2), midday distribution (Q3), late session runs (Q4).
Compare where the daily range forms versus the True Open to gauge premium/discount and likely continuations.
Execution: Look for standard ICT tools (liquidity sweeps, FVGs, displacement, PD arrays) inside the active quarter to avoid fighting time-of-day flow.
Review: Scroll back multiple days and evaluate where the day’s high/low typically forms relative to Q2–Q3; adapt expectations.
Settings (high level)
Show Macro Labels / Micro Lines / Micro Labels
Label position (above/below), X-shift, colors, sizes
Days to show, de-dup window (prevents label overlaps)
Q2 True Open toggle and extension (doesn't work)
Include Sunday as Q4 (18:00 NY)
Notes
Quarter boundaries are fixed to America/New York session logic to match ICT timing.
This is a context tool; it does not generate buy/sell signals. Combine with your existing execution model.
Past behavior does not guarantee future results. Use proper risk management.
Script protetto
Questo script è pubblicato come codice protetto. Tuttavia, è possibile utilizzarle liberamente e senza alcuna limitazione – ulteriori informazioni qui.
Declinazione di responsabilità
Le informazioni e le pubblicazioni non sono intese come, e non costituiscono, consulenza o raccomandazioni finanziarie, di investimento, di trading o di altro tipo fornite o approvate da TradingView. Per ulteriori informazioni, consultare i Termini di utilizzo.