PROTECTED SOURCE SCRIPT
smc bullrider 1.0
The smc bullrider 1.0 indicator is specifically crafted for mapping market structures. It excels in clearly recognizing type of Points Of Interest (SCOB) offering traders a straightforward and effective method to analyze market movements. It helps identify strategic entry points with precision.
🟠 Exploring Structure Mapping.
🔹This indicator presents a distinctive method for examining the market structure, emphasizing liquidity through the concept of 'Inducement'. Inducement plays a pivotal role in pinpointing essential structural indicators in the market, including Higher Highs (HH), Higher Lows (HL), Lower Lows (LL), and Lower Highs (LH).
🔹Consider Inducement as a strategically placed trap near supply or demand zones. It lures in eager buyers or sellers before the actual zone is reached, effectively creating liquidity. To validate an inducement, it must signify a legitimate pullback.
🔹A valid scenario arises when the price either sweeps or closes beyond the high or low of the preceding candle. In this context, the candle's color, whether bullish or bearish, holds no significance, and both situations are deemed valid. Inside bars are disregarded unless they meet this specific criterion. The indicator facilitates this process by automatically highlighting valid pullbacks with a distinctive gray round label.
🔹This feature serves not only as a visual guide but also as a vital tool for effortlessly comprehending market movements, offering a clear and visual representation of ongoing market trends
🟣 Understanding POI Functionality
🔹Single Candle Order Block (SCOB): Leveraging single-candle mitigation proves to be a powerful method for incorporating multiple entries into your successful trades.
🔵 How to Utilize the smc bullrider 1.0 Indicator:
🔹The smc bullrider 1.0 Indicator is crafted to elevate your trading strategy by pinpointing crucial order blocks and market signals. Below is a guide on how to make the most of the different components of the smc bullrider 1.0 Indicator:
🔹SCOB (Single Candle Order Block):
Application: SCOB is well-suited for scaling into a position. It is best utilized to increase positions when the market responds to OB or OB-EXT, signaling a potential reversal.
🟢Here's how to use it.
🔹Market Structure Drawing
This diagram depicts significant market indicators, such as instances of ascending prices (Higher Highs - HH) or descending prices (Lower Lows - LL). It serves as a valuable visual tool for comprehending the dynamics of market behavior
PICTURE (DIAGRAM)
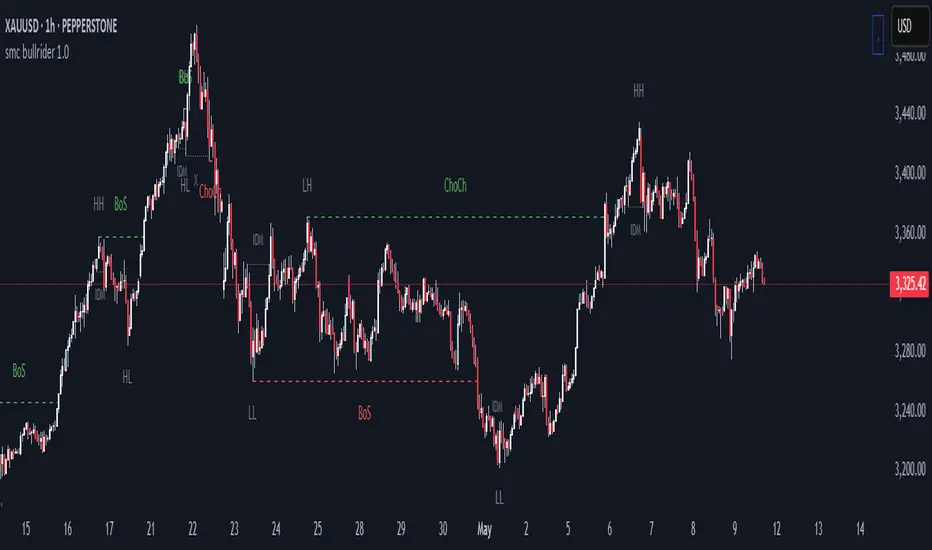
Live Chart Example: Our indicator efficiently dissects market structure, showcasing the 'Inducement' concept with precision in real-time trends—highlighting HH, HL, LL, and LH
PICTURE (REAL CHART)
Valid Pullback ( IDM ):
Valid Pullback Example: This image illustrates a common situation where the price extends beyond the high or low of the preceding candle, signifying a valid pullback. Pay attention to the identifiable gray dotted line label marking the inducement point.
PICTURE (DRAW/REAL)
Single Candle Order Block (SCOB)
The provided chart showcases the SCOB in a real trading setting, highlighting its effectiveness in optimizing trades.
🟡 Summary
🔹smc bullrider 1.0 Indicator distinguishes itself in the realm of market analysis, with a distinct focus on structure mapping and high-probability Point of Interest (POI).
Furthermore, it provides a visual representation of three key areas for each market move: discount, premium, and the equilibrium area at 50%. Its innovative approach involves scrutinizing market structure using the 'Inducement' concept, a pivotal strategy for identifying vital structural markers and steering
🟠 Exploring Structure Mapping.
🔹This indicator presents a distinctive method for examining the market structure, emphasizing liquidity through the concept of 'Inducement'. Inducement plays a pivotal role in pinpointing essential structural indicators in the market, including Higher Highs (HH), Higher Lows (HL), Lower Lows (LL), and Lower Highs (LH).
🔹Consider Inducement as a strategically placed trap near supply or demand zones. It lures in eager buyers or sellers before the actual zone is reached, effectively creating liquidity. To validate an inducement, it must signify a legitimate pullback.
🔹A valid scenario arises when the price either sweeps or closes beyond the high or low of the preceding candle. In this context, the candle's color, whether bullish or bearish, holds no significance, and both situations are deemed valid. Inside bars are disregarded unless they meet this specific criterion. The indicator facilitates this process by automatically highlighting valid pullbacks with a distinctive gray round label.
🔹This feature serves not only as a visual guide but also as a vital tool for effortlessly comprehending market movements, offering a clear and visual representation of ongoing market trends
🟣 Understanding POI Functionality
🔹Single Candle Order Block (SCOB): Leveraging single-candle mitigation proves to be a powerful method for incorporating multiple entries into your successful trades.
🔵 How to Utilize the smc bullrider 1.0 Indicator:
🔹The smc bullrider 1.0 Indicator is crafted to elevate your trading strategy by pinpointing crucial order blocks and market signals. Below is a guide on how to make the most of the different components of the smc bullrider 1.0 Indicator:
🔹SCOB (Single Candle Order Block):
Application: SCOB is well-suited for scaling into a position. It is best utilized to increase positions when the market responds to OB or OB-EXT, signaling a potential reversal.
🟢Here's how to use it.
🔹Market Structure Drawing
This diagram depicts significant market indicators, such as instances of ascending prices (Higher Highs - HH) or descending prices (Lower Lows - LL). It serves as a valuable visual tool for comprehending the dynamics of market behavior
PICTURE (DIAGRAM)
Live Chart Example: Our indicator efficiently dissects market structure, showcasing the 'Inducement' concept with precision in real-time trends—highlighting HH, HL, LL, and LH
PICTURE (REAL CHART)
Valid Pullback ( IDM ):
Valid Pullback Example: This image illustrates a common situation where the price extends beyond the high or low of the preceding candle, signifying a valid pullback. Pay attention to the identifiable gray dotted line label marking the inducement point.
PICTURE (DRAW/REAL)
Single Candle Order Block (SCOB)
The provided chart showcases the SCOB in a real trading setting, highlighting its effectiveness in optimizing trades.
🟡 Summary
🔹smc bullrider 1.0 Indicator distinguishes itself in the realm of market analysis, with a distinct focus on structure mapping and high-probability Point of Interest (POI).
Furthermore, it provides a visual representation of three key areas for each market move: discount, premium, and the equilibrium area at 50%. Its innovative approach involves scrutinizing market structure using the 'Inducement' concept, a pivotal strategy for identifying vital structural markers and steering
Script protetto
Questo script è pubblicato come codice protetto. Tuttavia, è possibile utilizzarle liberamente e senza alcuna limitazione – ulteriori informazioni qui.
Declinazione di responsabilità
Le informazioni e le pubblicazioni non sono intese come, e non costituiscono, consulenza o raccomandazioni finanziarie, di investimento, di trading o di altro tipo fornite o approvate da TradingView. Per ulteriori informazioni, consultare i Termini di utilizzo.