PROTECTED SOURCE SCRIPT
Gap Detection [Gold_Zilla]
📌 Gap Detection [Gold_Zilla]
Description:
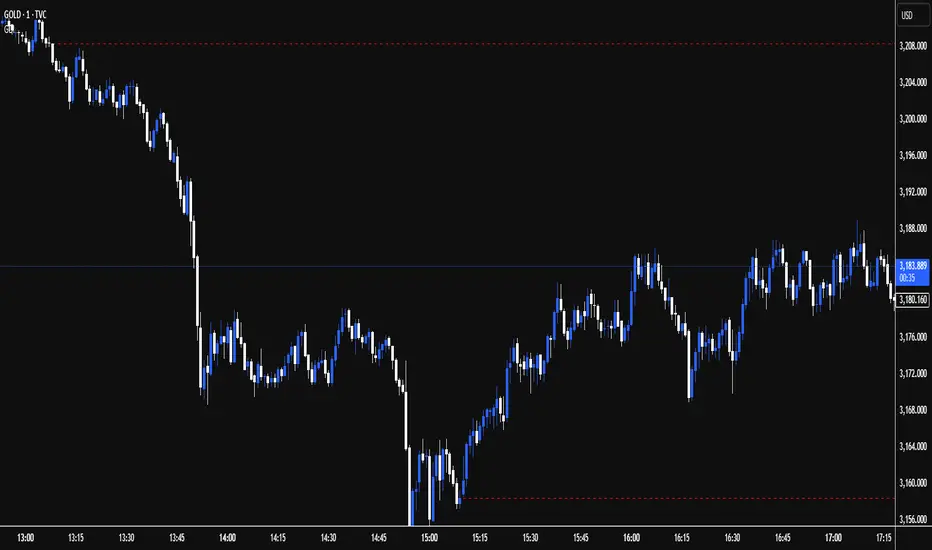
The Gap Detection [Gold_Zilla] indicator is designed to identify and visually mark price gaps between consecutive candles on your chart. Gaps can occur when a financial instrument opens at a significantly different price from its previous close, which some traders interpret as signals of strong momentum, market inefficiency, or upcoming reversals.
This tool helps users track such gaps in real time and monitor whether they have been filled — meaning price has retraced to the gap level after the gap appeared.
🔍 Core Features:
Automatic Gap Detection
Detects upward gaps (when today's low is above the previous close) and downward gaps (when today's high is below the previous close).
Customizable Sensitivity
Set a minimum gap size (% threshold) to filter out small price differences.
Real-Time Monitoring
Gaps are drawn as horizontal lines and persist until they are filled. Once filled (price crosses the gap level), they are automatically removed from the chart.
Visual Customization Options
Choose your gap line colors for up/down gaps
Select the line style (solid, dashed, dotted)
Adjust line width
Control the maximum number of tracked gaps (to reduce clutter)
Optional label display (disabled by default for minimalism)
⚙️ Inputs:
Minimum Gap Size (%) – Threshold to qualify a price movement as a gap (default: 1%).
Up/Down Gap Color – Colors for visualizing up/down gaps.
Line Style & Width – Format the gap lines to your preference.
Maximum Gaps to Track – Avoid performance issues by limiting active gap lines.
Show Gap Labels (currently disabled in code) – Option to label gap levels with price and direction.
📈 How to Use:
Add this script to your chart on any timeframe or asset.
Gaps will appear automatically as horizontal lines, helping you spot unfilled gaps.
Can be used to identify potential support/resistance zones, or areas where price may return to fill a gap.
Note: Not all gaps get filled — always combine with other forms of analysis or confirmation tools.
⚠️ Disclaimer:
This script is for informational and educational purposes only and does not constitute financial advice. Past performance or price behavior does not guarantee future results. Always use proper risk management and consult a financial advisor before making trading decisions.
 GOLD
GOLD

Description:
The Gap Detection [Gold_Zilla] indicator is designed to identify and visually mark price gaps between consecutive candles on your chart. Gaps can occur when a financial instrument opens at a significantly different price from its previous close, which some traders interpret as signals of strong momentum, market inefficiency, or upcoming reversals.
This tool helps users track such gaps in real time and monitor whether they have been filled — meaning price has retraced to the gap level after the gap appeared.
🔍 Core Features:
Automatic Gap Detection
Detects upward gaps (when today's low is above the previous close) and downward gaps (when today's high is below the previous close).
Customizable Sensitivity
Set a minimum gap size (% threshold) to filter out small price differences.
Real-Time Monitoring
Gaps are drawn as horizontal lines and persist until they are filled. Once filled (price crosses the gap level), they are automatically removed from the chart.
Visual Customization Options
Choose your gap line colors for up/down gaps
Select the line style (solid, dashed, dotted)
Adjust line width
Control the maximum number of tracked gaps (to reduce clutter)
Optional label display (disabled by default for minimalism)
⚙️ Inputs:
Minimum Gap Size (%) – Threshold to qualify a price movement as a gap (default: 1%).
Up/Down Gap Color – Colors for visualizing up/down gaps.
Line Style & Width – Format the gap lines to your preference.
Maximum Gaps to Track – Avoid performance issues by limiting active gap lines.
Show Gap Labels (currently disabled in code) – Option to label gap levels with price and direction.
📈 How to Use:
Add this script to your chart on any timeframe or asset.
Gaps will appear automatically as horizontal lines, helping you spot unfilled gaps.
Can be used to identify potential support/resistance zones, or areas where price may return to fill a gap.
Note: Not all gaps get filled — always combine with other forms of analysis or confirmation tools.
⚠️ Disclaimer:
This script is for informational and educational purposes only and does not constitute financial advice. Past performance or price behavior does not guarantee future results. Always use proper risk management and consult a financial advisor before making trading decisions.
Script protetto
Questo script è pubblicato come codice protetto. Tuttavia, è possibile utilizzarle liberamente e senza alcuna limitazione – ulteriori informazioni qui.
Declinazione di responsabilità
Le informazioni e le pubblicazioni non sono intese come, e non costituiscono, consulenza o raccomandazioni finanziarie, di investimento, di trading o di altro tipo fornite o approvate da TradingView. Per ulteriori informazioni, consultare i Termini di utilizzo.