OPEN-SOURCE SCRIPT
PULLBACK CANDLESTICK STRATEGY BY SIMPLE TRADING TECHNIQUES
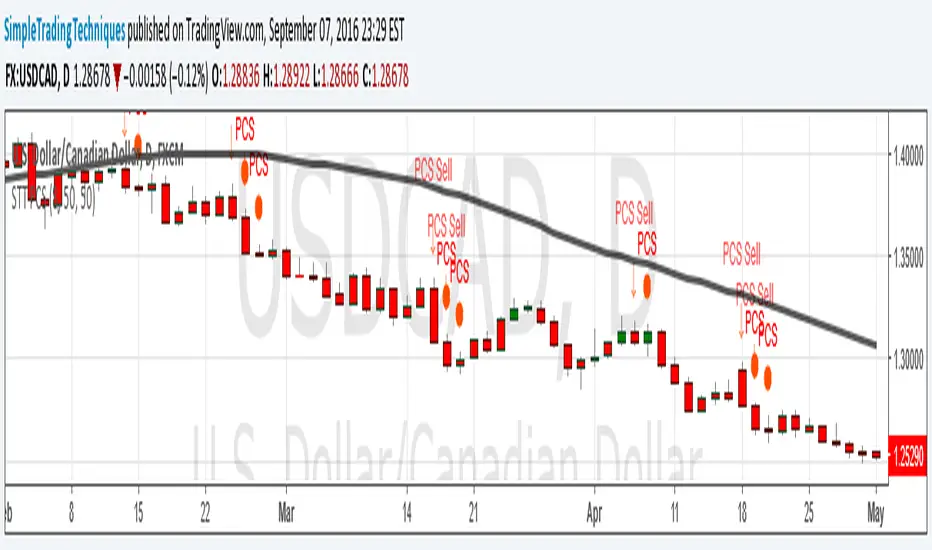
Arrow represent trade setup
Circle represent triggering of the trade
--------------------------------------------------------------------
1. Where to place stop loss?
2. Where to exit the trade?
3. How to protect gains in your trade?
4. How to apply money management rule?
5. How to trade gap opening?
Circle represent triggering of the trade
--------------------------------------------------------------------
1. Where to place stop loss?
2. Where to exit the trade?
3. How to protect gains in your trade?
4. How to apply money management rule?
5. How to trade gap opening?
Script open-source
In pieno spirito TradingView, il creatore di questo script lo ha reso open-source, in modo che i trader possano esaminarlo e verificarne la funzionalità. Complimenti all'autore! Sebbene sia possibile utilizzarlo gratuitamente, ricorda che la ripubblicazione del codice è soggetta al nostro Regolamento.
Declinazione di responsabilità
Le informazioni ed i contenuti pubblicati non costituiscono in alcun modo una sollecitazione ad investire o ad operare nei mercati finanziari. Non sono inoltre fornite o supportate da TradingView. Maggiori dettagli nelle Condizioni d'uso.