OPEN-SOURCE SCRIPT
Aggiornato Fixed Fibonacci Support Resistance

I took the formula of the fibonacci from LonesomeTheBlue and made this script. You can take a look at his indicator here: 
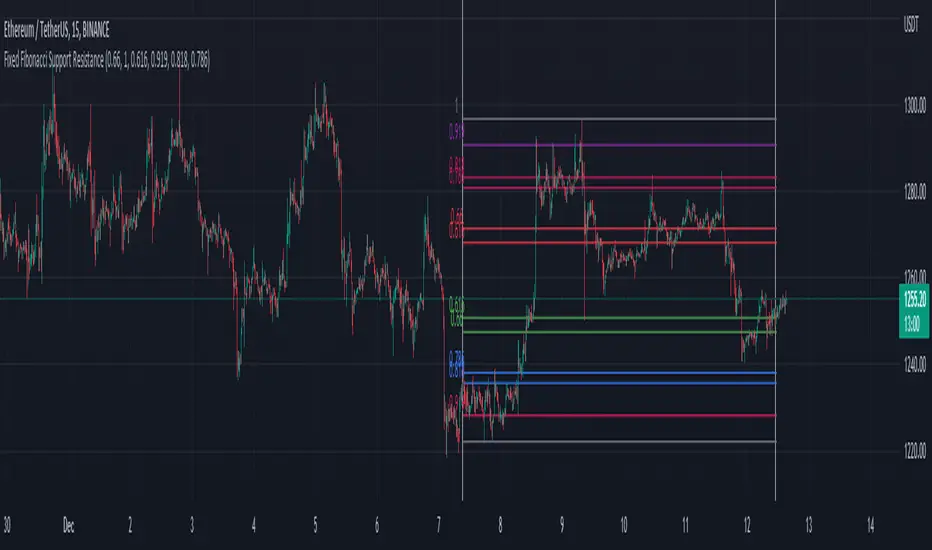
When you first add the indicator on the chart, click on the chart to select the first date and then the second date. It will then calculate the fibonacci support and resistance of the range you choose. You can also choose the date inside the inputs.
Be sure the first date is before the second date, otherwise it won't be able to show the fibonacci. If that happen, choose a correct date in the inputs.
Note di rilascio
The original code is from LonesomeTheBlue in the Fibonacci Levels MTF script.Note di rilascio
-Added a bool to extend the fibonacci to the right. -I changed the fibonacci to start from start time to end time instead of starting at end time.
-Added a bool to show/hide the start/end white line.
Script open-source
Nello spirito di TradingView, l'autore di questo script lo ha reso open source, in modo che i trader possano esaminarne e verificarne la funzionalità. Complimenti all'autore! Sebbene sia possibile utilizzarlo gratuitamente, ricordiamo che la ripubblicazione del codice è soggetta al nostro Regolamento.
Declinazione di responsabilità
Le informazioni e le pubblicazioni non sono intese come, e non costituiscono, consulenza o raccomandazioni finanziarie, di investimento, di trading o di altro tipo fornite o approvate da TradingView. Per ulteriori informazioni, consultare i Termini di utilizzo.