OPEN-SOURCE SCRIPT
Candlesticks Patterns Identified
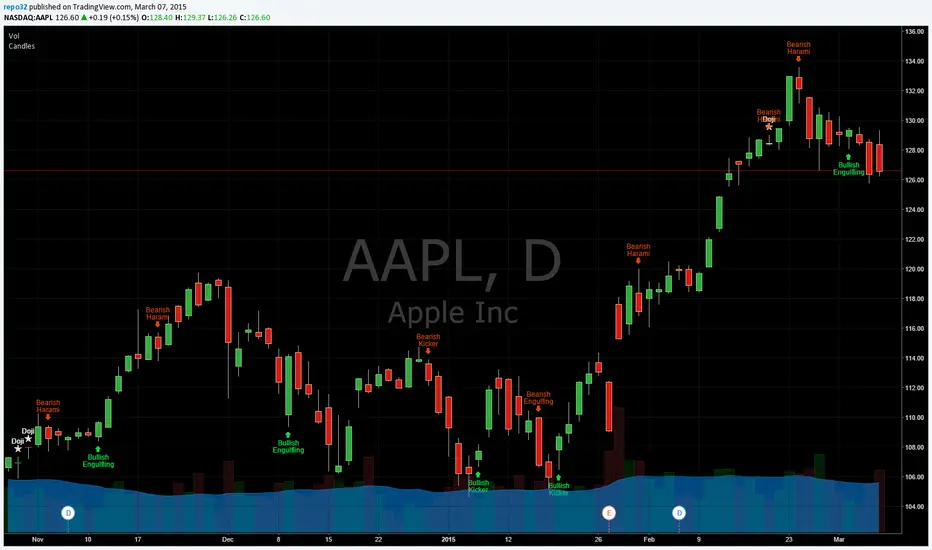
I was using another script that colored the bars to show the different candle patterns. Thanks to HPotter (tradingview.com/u/HPotter/). Unfortunately, I can't think that fast when looking across a screen of charts with different color bars. Fortunately, Tradingview came up with symbols and names on 2/26/15. I decided to take my favorite symbols and attach them to a name. This makes it easier to see what is going on and where your entry would be if it confirms. Works beautifully for me. Decided to share. I also added the ability to alter what shows up based upon a look back. A bullish engulfing at the top of a trend, or a bearish harami at the bottom of the trend, is nearly useless and clutters the chart. I have the default set for the open of the current bar to be higher or lower than the open from 5 bars back. You can adjust in the settings to what you like. This trend setting is on all the patterns except doji. If you want to see all the candle patterns, set it to "1".
The doji can be adjusted as well. I left some other patterns at the bottom of the script, but they are turned off. They became too much of a clutter for me. I prefer DovCaspi's pattern finder for hammers and stars: tradingview.com/v/L15YjzZb/ I use his due to the clean appearance.
The default script has: Doji, Bearish Harami, Bullish Harami, Bearish Engulfing, Bullish Engulfing, Piercing Line, Bullish Belt, Bullish Kicker, and Bearish Kicker. You can turn off what you don't like. The Piercing Line, Bullish Belt, and the Kickers will usually show up better in the daily charts.
If you would like the updated version, see the Related Ideas below:
Script open-source
In pieno spirito TradingView, il creatore di questo script lo ha reso open-source, in modo che i trader possano esaminarlo e verificarne la funzionalità. Complimenti all'autore! Sebbene sia possibile utilizzarlo gratuitamente, ricorda che la ripubblicazione del codice è soggetta al nostro Regolamento.
Pubblicazioni correlate
Declinazione di responsabilità
Le informazioni ed i contenuti pubblicati non costituiscono in alcun modo una sollecitazione ad investire o ad operare nei mercati finanziari. Non sono inoltre fornite o supportate da TradingView. Maggiori dettagli nelle Condizioni d'uso.