OPEN-SOURCE SCRIPT
HersG High Low Bar Charts Layout
Hello friends,
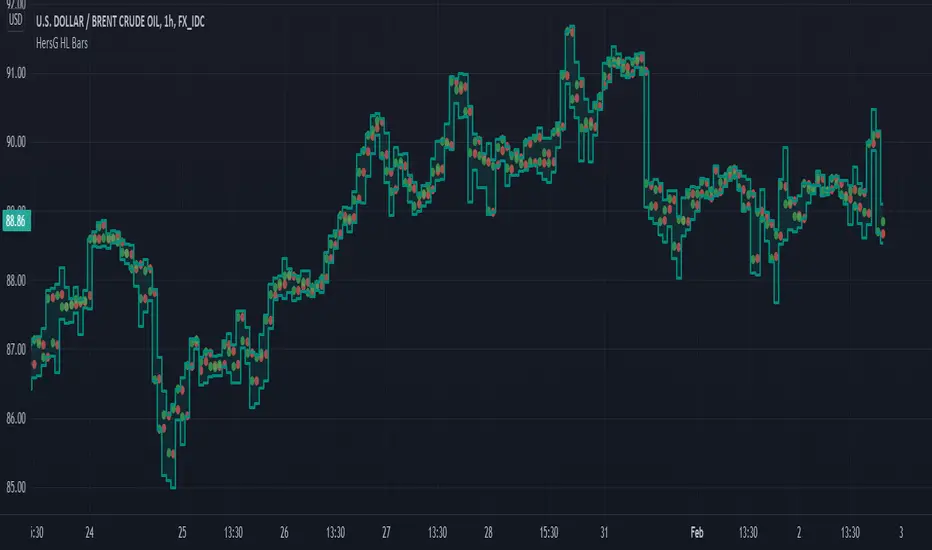
The following indicator will create a new form of chart layout in High & Low as candle-like full bars instead of Open and Close. There are no wicks, only full bars highlighting High and Low of the select time frame. Two dots inside a bar will represent Open (Red dot) and Close (Green dot).
How can it help you as a trader?
High and Low candle-like bars will clear the noise from charts in identifying support & resistance, higher-highs and lower-lows will be clearly visible thus helping you make trades.
First add the indicator and then hover the mouse pointer over the ticker in the charts and click on the “eye-shaped” symbol to hide the candlesticks chart pattern.
The type of chart layout is standard charts. Data are not re-calculated or manipulated.
Regards!
Script open-source
Nello spirito di TradingView, l'autore di questo script lo ha reso open source, in modo che i trader possano esaminarne e verificarne la funzionalità. Complimenti all'autore! Sebbene sia possibile utilizzarlo gratuitamente, ricordiamo che la ripubblicazione del codice è soggetta al nostro Regolamento.
Declinazione di responsabilità
Le informazioni e le pubblicazioni non sono intese come, e non costituiscono, consulenza o raccomandazioni finanziarie, di investimento, di trading o di altro tipo fornite o approvate da TradingView. Per ulteriori informazioni, consultare i Termini di utilizzo.