OPEN-SOURCE SCRIPT
SignalWatcher
This script provides real-time monitoring of multiple technical indicators and generates visual alerts and configurable alarms:
Inputs & Mini-GUI
MACD Settings: Activation, fast, slow and signal line lengths.
RSI Settings: Activation, period length, overbought and oversold thresholds.
ADX Settings: Activation, period length, smoothing and trend strength thresholds.
Volume Settings: Activation, length of the volume MA, factor for detecting volume peaks.
Global Alert: A single composite alert for all signals.
Plot Settings: Activation and deactivation of the plot displays for RSI, MACD (lines) and ADX. Color and width selection for each line.
Display Table: Activation of the status table.
Calculations
MACD: Generates macdLine and signalLine, detects crossovers (bullish) and crossunders (bearish).
RSI: Calculates rsi_val, compares with rsi_ob and rsi_os to determine overbought/oversold.
ADX: Uses ta.dmi() to determine adx_val and checks against adx_thresh for trend strength.
Volume Spike: Exceptional trading activity detected by moving average (vol_ma) and factor (vol_factor).
Alert conditions
Six individual alertcondition() calls: MACD ↑/↓, RSI Overbought/Oversold, ADX Strong Trend, Volume Spike.
Optional composite alert (enable_global): A single notification when one of the indicator signals strikes.
Visual overlays
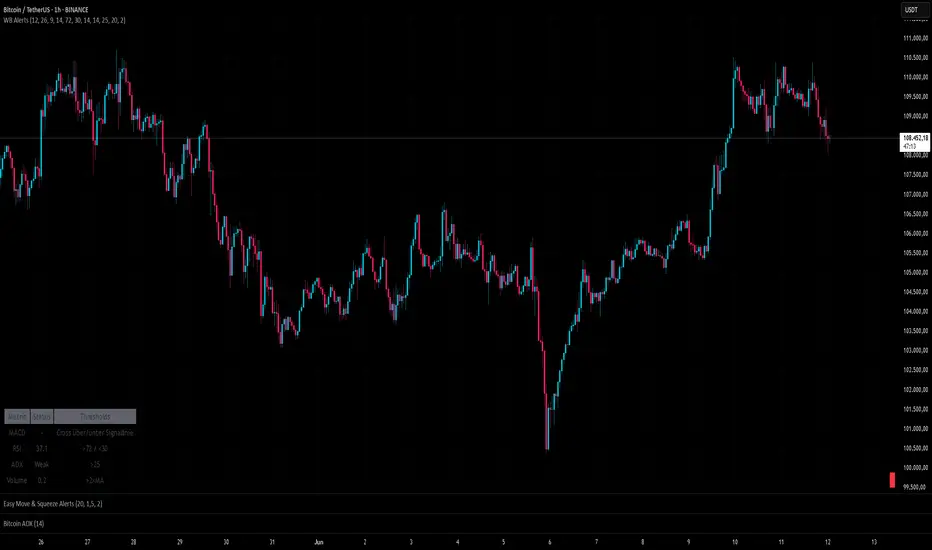
Alarm overlay (bottom right): Red table with text lines for currently triggered signals.
Status Table (bottom left): Overview of all indicators with current status (On/Off, Values, Thresholds).
Plots in the chart
RSI, MACD Line & Signal Line, ADX: Are displayed as lines if activated in the GUI; configurable colors & line thicknesses.
Inputs & Mini-GUI
MACD Settings: Activation, fast, slow and signal line lengths.
RSI Settings: Activation, period length, overbought and oversold thresholds.
ADX Settings: Activation, period length, smoothing and trend strength thresholds.
Volume Settings: Activation, length of the volume MA, factor for detecting volume peaks.
Global Alert: A single composite alert for all signals.
Plot Settings: Activation and deactivation of the plot displays for RSI, MACD (lines) and ADX. Color and width selection for each line.
Display Table: Activation of the status table.
Calculations
MACD: Generates macdLine and signalLine, detects crossovers (bullish) and crossunders (bearish).
RSI: Calculates rsi_val, compares with rsi_ob and rsi_os to determine overbought/oversold.
ADX: Uses ta.dmi() to determine adx_val and checks against adx_thresh for trend strength.
Volume Spike: Exceptional trading activity detected by moving average (vol_ma) and factor (vol_factor).
Alert conditions
Six individual alertcondition() calls: MACD ↑/↓, RSI Overbought/Oversold, ADX Strong Trend, Volume Spike.
Optional composite alert (enable_global): A single notification when one of the indicator signals strikes.
Visual overlays
Alarm overlay (bottom right): Red table with text lines for currently triggered signals.
Status Table (bottom left): Overview of all indicators with current status (On/Off, Values, Thresholds).
Plots in the chart
RSI, MACD Line & Signal Line, ADX: Are displayed as lines if activated in the GUI; configurable colors & line thicknesses.
Script open-source
Nello spirito di TradingView, l'autore di questo script lo ha reso open source, in modo che i trader possano esaminarne e verificarne la funzionalità. Complimenti all'autore! Sebbene sia possibile utilizzarlo gratuitamente, ricordiamo che la ripubblicazione del codice è soggetta al nostro Regolamento.
Declinazione di responsabilità
Le informazioni e le pubblicazioni non sono intese come, e non costituiscono, consulenza o raccomandazioni finanziarie, di investimento, di trading o di altro tipo fornite o approvate da TradingView. Per ulteriori informazioni, consultare i Termini di utilizzo.