PROTECTED SOURCE SCRIPT
Aggiornato ICT Opening Range Gap
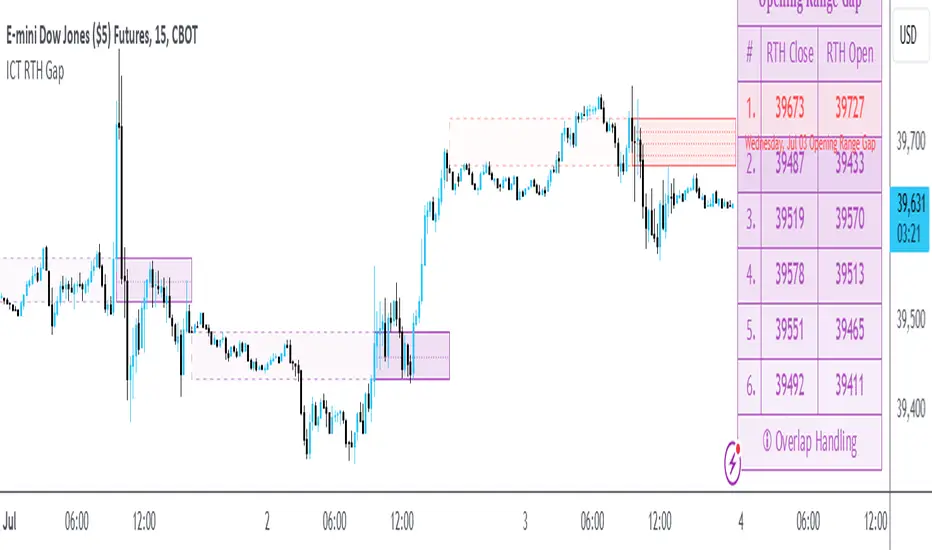
Opening Range Gap
The Opening Range Gap, also known as the Regular Trading Hours (RTH) Gap, is the distance between the first opening tick of a session and the previous session's close, when looking at a chart's Regular Trading Hours (not to be confused with Electronic Trading Hours). This gap is an important element for Futures Market traders that follow the works of The Inner Circle Trader (ICT). To be more specific, the Opening Range Gap occurs between 4:15pm [UTC-4] and 9:30am of the next day.

The Opening Range Gap can be viewed easily when switching the session type to "Regular trading hours".
The image above shows an example of an RTH Gap for Wednesday, June 12, 2024 in ES1!
ES1!
How To Use Opening Range Gap
The Opening Range Gap can be used like any other form of a gap by extending it into future price action and looking for it to be filled on the same day or the upcoming days.
Looking for 50% of the gap to be filled as an initial target is one of the methodologies taught by ICT. Additionally, the high and low of the gap (as well as the midpoint) can be used as points of dynamic support & resistance, even if the gap is already filled. Therefore, these gaps do not "expire", and they can be used as key price levels extended through to the end of the week.
Disclaimer
This indicator is mainly intended to work for Futures markets, and specifically the following Index Futures markets: E-mini S&P 500 Futures, E-mini NASDAQ-100 Futures, E-mini DOW Futures.
Given that, the indicator still supports various other markets/assets out-of-the-box, such as other types of Futures Markets, Stocks, Options, and more. The main difference will be that other markets may have RTH Gaps forming at different times, rather than the 4:15pm-9:30am gap that occurs in the Index Futures (Regular trading hours).
Indicator Purpose
While RTH Gaps can be labeled by hand, this indicator allows you to quickly plot multiple RTH Gaps and get a quick glimpse at potential gaps that you may have missed, which could end up being useful in your analysis.
This indicator is 100% custom-built, not using code from any other existing indicators that may plot Opening Range Gaps. The main purpose of this indicator was to overcome many shortcomings from other existing indicators, most notably the problem of displaying RTH Gaps while using ETH as the chart session.
Therefore, this indicator has many UNIQUE features, such as:
Error Messages
There are some conditions which can cause the script to fail and display an error message (by clicking the red exclamation mark next to the indicator.)
Error messages:

This is an example of what a script error would look like.
Indicator Settings
Most settings are self-explanatory or have a tooltip with information on what the setting does, but this section will only briefly cover the available settings.

Current RTH Gap Style
These settings are used to customize the visual style of the most recent RTH Gap (also known as the "Current" RTH Gap). Note: the exact same set of settings are available for the Previous RTH Gaps. The text label next to each gap can be optionally hidden to clean the chart a little.
Price Table
These are settings to customize the appearance of the Price Table on the right, including the ability to hide it completely. Note: to actually use the color configurations, you must select "Custom Style" in one of the dropdowns, otherwise it will use "Default Style" which means that the Price Table is automatically styled based on the colors chosen in the Current RTH Gap Style and Previous RTH Gap Style settings.
Overlap Handling
One of 7 available overlap handling options can be used to filter which RTH Gaps are plotted on the chart. By default, the "None" option will be selected, meaning that all valid RTH Gaps are plotted on the chart.
Formatting
Tooltips
The indicator provides additional details about an RTH Gap when you hover over a row in the Price Table.

Note: the same information can be found by hovering over the Text Label that is to the right of each RTH Gap (even when the Text Label is disabled via the Settings).
Overlap Handling
The tooltip next to "Select a Strategy" in the options will provide details on each overlap handling strategy. Additionally, when a strategy is selected, a new row in the Price Table will appear; hovering over that will show details about the currently selected strategy, as well as any suggestions in case the inputs were invalid. When a strategy hides an RTH Gap, the number in the Price Table will be replaced with an "Eye" icon, indicating that it is not currently plotted on the chart.
Available strategies are:

This is an example that chooses the Overlap Handling Strategy Option 6. Note that in this example, the tooltip in the price table shows a warning that the Input Number should be increased to plot some RTH Gaps on the chart.
Tips

The Opening Range Gap, also known as the Regular Trading Hours (RTH) Gap, is the distance between the first opening tick of a session and the previous session's close, when looking at a chart's Regular Trading Hours (not to be confused with Electronic Trading Hours). This gap is an important element for Futures Market traders that follow the works of The Inner Circle Trader (ICT). To be more specific, the Opening Range Gap occurs between 4:15pm [UTC-4] and 9:30am of the next day.
The Opening Range Gap can be viewed easily when switching the session type to "Regular trading hours".
The image above shows an example of an RTH Gap for Wednesday, June 12, 2024 in
How To Use Opening Range Gap
The Opening Range Gap can be used like any other form of a gap by extending it into future price action and looking for it to be filled on the same day or the upcoming days.
Looking for 50% of the gap to be filled as an initial target is one of the methodologies taught by ICT. Additionally, the high and low of the gap (as well as the midpoint) can be used as points of dynamic support & resistance, even if the gap is already filled. Therefore, these gaps do not "expire", and they can be used as key price levels extended through to the end of the week.
Disclaimer
This indicator is mainly intended to work for Futures markets, and specifically the following Index Futures markets: E-mini S&P 500 Futures, E-mini NASDAQ-100 Futures, E-mini DOW Futures.
Given that, the indicator still supports various other markets/assets out-of-the-box, such as other types of Futures Markets, Stocks, Options, and more. The main difference will be that other markets may have RTH Gaps forming at different times, rather than the 4:15pm-9:30am gap that occurs in the Index Futures (Regular trading hours).
Indicator Purpose
While RTH Gaps can be labeled by hand, this indicator allows you to quickly plot multiple RTH Gaps and get a quick glimpse at potential gaps that you may have missed, which could end up being useful in your analysis.
This indicator is 100% custom-built, not using code from any other existing indicators that may plot Opening Range Gaps. The main purpose of this indicator was to overcome many shortcomings from other existing indicators, most notably the problem of displaying RTH Gaps while using ETH as the chart session.
Therefore, this indicator has many UNIQUE features, such as:
- Ability to maintain accuracy of the closing/opening prices even when changing chart settings (e.g., toggling ETH/RTH sessions, toggling BACK-ADJUSTMENT on futures contracts, toggling SETTLEMENT prices, etc.).
- Draw up to 25 previous Opening Range Gaps, even on ultra-low timeframes like the 1-minute or 1-second chart.
- Automatically or manually choose which Opening Range Gaps to hide/show on the chart.
- Highly customizable, including a different color scheme to easily distinguish between the Current and Previous RTH Gaps.
- Modified price values to correctly display prices that use a format like 109'32 (e.g., Bond Futures or Wheat Futures).
- Helpful tooltips to provide more detailed information about the RTH Gaps or about the current Input Settings.
Error Messages
There are some conditions which can cause the script to fail and display an error message (by clicking the red exclamation mark next to the indicator.)
Error messages:
- Use a Standard Chart Type: this will occur when using a non-standard chart such as Heikin Ashi, Renko, Point & Figure, etc.
- Use a Daily or Lower Timeframe: this error will appear when using a higher timeframe chart like weekly or monthly, because it can clutter the chart since RTH Gaps can form every day.
- RTH Gap was not detected: this means that no RTH gap was found, which will occur on markets that don't have the option to toggle between ETH and RTH sessions (e.g., Forex or Crypto).
- Exceeded the maximum lookback for Bar Replay mode: when using bar replay mode; this can depend on the amount of historical bars available in different account subscription types.
- Unable to Activate Bar Replay mode: if the indicator could not be used in Bar Replay mode.
- Restart Bar Replay: if the indicator works in Bar Replay but it detected an error that would cause RTH Gaps to be plotted incorrectly.
This is an example of what a script error would look like.
Indicator Settings
Most settings are self-explanatory or have a tooltip with information on what the setting does, but this section will only briefly cover the available settings.
- Extend to End of Day: This setting is enabled by default. It will extend each RTH Gap only up to the end of its day (specifically, to the RTH close of the day). The option can be toggled OFF to automatically extend all RTH Gaps to the right-most candle on the chart.
- Previous RTH Gaps: Between 1 and 25 previous RTH Gaps can be displayed. The checkbox can be toggled to quickly hide all previous RTH Gaps (but the same effect would be reached by setting the value to 0).
- Hide Current RTH Gap: The Current RTH Gap (most recent one), can be optionally hidden from being plotted.
- Beginning Anchor Point: Choose the beginning anchor point for all RTH Gaps. The default is "RTH Close", which means that each gap will be drawn on the chart starting from their previous session's RTH close @ 4:15pm. But it will be a more transparent version of the actual gap; this ghost-like image will extend from 4:15pm all the way up to 9:30am where the gap will then be drawn normally from 9:30am onwards. The other option for this setting is "RTH Open" which means that the gap will be drawn starting from the actual 9:30am opening.
Current RTH Gap Style
These settings are used to customize the visual style of the most recent RTH Gap (also known as the "Current" RTH Gap). Note: the exact same set of settings are available for the Previous RTH Gaps. The text label next to each gap can be optionally hidden to clean the chart a little.
Price Table
These are settings to customize the appearance of the Price Table on the right, including the ability to hide it completely. Note: to actually use the color configurations, you must select "Custom Style" in one of the dropdowns, otherwise it will use "Default Style" which means that the Price Table is automatically styled based on the colors chosen in the Current RTH Gap Style and Previous RTH Gap Style settings.
Overlap Handling
One of 7 available overlap handling options can be used to filter which RTH Gaps are plotted on the chart. By default, the "None" option will be selected, meaning that all valid RTH Gaps are plotted on the chart.
Formatting
- Date Format: select the format of the date that is shown next to each RTH Gaps.
- Timezone: choose the timezone for the RTH Gap closing/opening date-times that are displayed (only in tooltips when you hover over an RTH Gap label).
- RTH Gap Label: choose the details to display next to each gap (e.g., date, or gap number, or both).
- Price Format: only two options: Auto/Decimal. "Auto" uses custom processing to allow displaying values such as 109'32 for Bond futures.
Tooltips
The indicator provides additional details about an RTH Gap when you hover over a row in the Price Table.
Note: the same information can be found by hovering over the Text Label that is to the right of each RTH Gap (even when the Text Label is disabled via the Settings).
Overlap Handling
The tooltip next to "Select a Strategy" in the options will provide details on each overlap handling strategy. Additionally, when a strategy is selected, a new row in the Price Table will appear; hovering over that will show details about the currently selected strategy, as well as any suggestions in case the inputs were invalid. When a strategy hides an RTH Gap, the number in the Price Table will be replaced with an "Eye" icon, indicating that it is not currently plotted on the chart.
Available strategies are:
- Option 1 (Gradients): select the percentage opacity to shade RTH Gaps in. The more recent RTH Gaps will be closer to the maximum opacity defined, while the older RTH Gaps will appear more transparent, closer to the minimum opacity defined. Note: only affects previous RTH Gaps, not the current RTH Gap.
- Option 2 (Day Extension): select the number of days to extend each RTH Gap up to. Note: this will override the "Extend to End of Day" setting, regardless whether it is toggled ON or OFF.
- Option 3 (Nested Gaps): hides nested gaps, i.e., RTH Gaps that are enclosed within another RTH Gap. Note: this option is only available when the "Extend to End of Day" setting is disabled.
- Option 4 (Intersecting Gaps): hides intersecting/overlapping gaps, i.e., RTH Gaps that overlap one another (this may also include, but is not limited to, nested gaps). The drop-down next to this option allows choosing the priority of which RTH Gaps to hide first. Note: this option is only available when the "Extend to End of Day" setting is disabled.
- Option 5 (Gap Width): the chart will only show RTH Gaps that have a width/size between the defined parameters.
- Option 6 (Close Proximity): the chart will only show the RTH Gaps that are within a certain range from the market price. This can be useful when plotting multiple RTH Gaps while using auto-scaling on the chart. By only showing nearby RTH Gaps, it will prevent the auto-scaling from having to compress the candles to fit the far-away RTH Gaps onto the screen.
- Option 7 (CSV): this option is used if none of the others suit you well; it allows specifically choosing which RTH Gaps to hide or show on the chart.
This is an example that chooses the Overlap Handling Strategy Option 6. Note that in this example, the tooltip in the price table shows a warning that the Input Number should be increased to plot some RTH Gaps on the chart.
Tips
- Chart settings can be toggled to "Scale price chart only" to prevent the auto-scaling of TradingView from compressing the chart if there are RTH Gaps that are far away from the current market action.
- If you change a lot of indicator settings such as RTH Gap color schemes, you can save the settings as the Default to prevent your settings from resetting the next time you use the indicator.
Note di rilascio
User-requested update to add special coloring for candles on the chart that are outside of Regular Trading Hours (RTH).Example: the candles outside of the RTH session are whited-out. This effect can be toggled ON or OFF.
In the settings, you can choose a time window to keep the candles unchanged. By default, it will be the Index Futures RTH hours (9:30am to 4:15pm NY time). This time window is adjustable for users that also focus on pre-market or post-market trading sessions. Additionally, the candle colors are customizable for both Bullish and Bearish candles (note: only the bodies are modified with the chosen colors).
Note di rilascio
- New setting: "Show Zero-Width Gaps" to allow plotting the 9:30am opening price even if it is the same as the previous day's settlement price; this price level can still be useful for support/resistance.
- New setting: "Bar Offset" to allow shifting Opening Range Gaps to the right.
- New setting: "Minimum Gap Width to Plot C.E." which will hide C.E. levels if the Opening Range Gap is less than a certain size.
- New setting: "Minimum Gap Width to Plot Quadrants" which will hide upper quadrant and lower quadrant levels if the Opening Range Gap is less than a certain size.
- Line Style & Width can now be adjusted for all gap levels (high/low, C.E., upper/lower quadrants).
- Additional date format options, including full month names.
- Removed setting: "
Price Format" since no issues were reported with the displayed price levels. - Added the ability to draw Opening Range Gaps using lines instead of boxes (see example below).
Example of Indicator Settings changed to plot Opening Range Gaps using Lines instead of Boxes.
Note di rilascio
Moved to Pine Script v6Additional minor changes:
- Text Labels: using the new built-in 𝗯𝗼𝗹𝗱 & 𝘪𝘵𝘢𝘭𝘪𝘤 text formatting. Also added the 𝕕𝕠𝕦𝕓𝕝𝕖-𝕤𝕥𝕣𝕦𝕔𝕜 font option.
- Price Table: added the 𝘪𝘵𝘢𝘭𝘪𝘤 and 𝕕𝕠𝕦𝕓𝕝𝕖-𝕤𝕥𝕣𝕦𝕔𝕜 font options.
- Text Size: larger variety of text sizes to choose from.
- Date Format: additional date format options including DD/MM format.
- Timezone: larger variety of timezones to choose from.
- Using 12-hour format to display Opening Range Gap start & end times (within the pop-up tooltips) instead of the 24-hour format.
- More options for labeling the Opening Range Gaps.
Script protetto
Questo script è pubblicato come codice protetto. Tuttavia, è possibile utilizzarle liberamente e senza alcuna limitazione – ulteriori informazioni qui.
Declinazione di responsabilità
Le informazioni e le pubblicazioni non sono intese come, e non costituiscono, consulenza o raccomandazioni finanziarie, di investimento, di trading o di altro tipo fornite o approvate da TradingView. Per ulteriori informazioni, consultare i Termini di utilizzo.