OPEN-SOURCE SCRIPT
Aggiornato [blackcat] L1 Volume Dynamics
Level: 1
Background
Use the difference of Jurik MA and SMA equivalent (ALMA) to observe something new for volume.
Function
Trading volume is an important technical indicator that is not easy to see the law. I try to match the trading volume with the deduction theory, and the deduction double-average theory is matched with the measurement capacity. I will compare the two moving averages of ultra-short-term, short-term, medium-term and long-term. The faster moving average I choose is Jurik MA (JMA), because it is faster than EMA under the same parameters, and the smoothing effect is very good. In addition to the slow moving average, I use ALMA to benchmark SMA. Because the smoothing properties of ALMA are better. A law is used here, that is, the equivalent relationship between ALMA and SMA is approximately a Fibonacci sequence. I can dynamically apply this amount to the Bitcoin market and see some interesting phenomena.
What is double average volume? According to normal circumstances, JMA will follow the transaction volume faster than SMA. The transaction volume is normally rising above the double average volume, and the transaction volume is normally falling below the double average volume. When the SMA follows the trading volume faster than the JMA, it is abnormal (usually occurs in the divergence segment), that is, the JMA is above the SMA, but the trading volume is below the SMA (the bottom divergence volume pile), the top divergence volume pile is the opposite process. The trading volume is between the double average volume, which is the finishing volume energy. It can be used in the breakthrough of the box and the bottom of the pot. By comparing the strength of the current trading volume with the strength of the trading volume on the upper edge of the box or bottom structure, it can improve the success rate of predicting the breakthrough, especially for the observation effect of large funds latent.
Remarks
Feedbacks are appreciated.
Note di rilascio
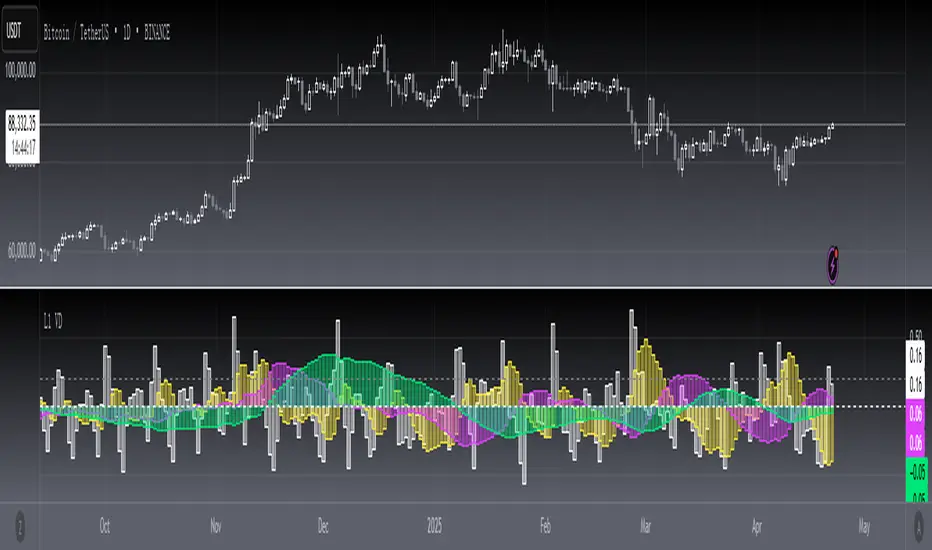
OVERVIEWThe L1 Volume Dynamics indicator analyzes market volume patterns using a sophisticated combination of Jurik Moving Average (JMA) and Adaptive Moving Average (ALMA). This script creates visual representations of different timeframes' volume behaviors through columns and steplines, helping traders identify potential buying and selling opportunities based on volume trends.
FEATURES
• Multi-timeframe volume analysis:
Ultra-short term (8 bars)
Short term (22 bars)
Middle term (64 bars)
Long term (121 bars)
• Dynamic threshold system for customizable sensitivity settings
• Visual signals through colored columns and steplines
• Real-time buy/sell alerts with notifications
• Support for custom price source selection
HOW TO USE
Open the indicator settings panel
Adjust the Jurik Moving Average parameters:
Length: Default 17 | Range: 0-∞
Phase: Default 34 | Range: 0-∞
Power: Default 2.5 | Step: 0.5 increments
Set the Dynamic Threshold Value to control alert sensitivity
Monitor the chart for:
Green columns indicating positive volume momentum
Red columns showing negative volume pressure
White lines representing baseline movement thresholds
LIMITATIONS
• Requires sufficient historical data for accurate calculations
• Most effective in trending markets
• May generate false signals during choppy market conditions
• Best used alongside other technical indicators for confirmation
NOTES
📌 The indicator uses ALMA smoothing for more responsive volume readings compared to traditional moving averages.
💡 Signals are generated when all four timeframe volumes align above/below the dynamic threshold.
🔔 Alerts can be customized further within TradingView's alert manager.
Script open-source
Nello spirito di TradingView, l'autore di questo script lo ha reso open source, in modo che i trader possano esaminarne e verificarne la funzionalità. Complimenti all'autore! Sebbene sia possibile utilizzarlo gratuitamente, ricordiamo che la ripubblicazione del codice è soggetta al nostro Regolamento.
Avoid losing contact!Don't miss out! The first and most important thing to do is to join my Discord chat now! Click here to start your adventure: discord.com/invite/ZTGpQJq 防止失联,请立即行动,加入本猫聊天群: discord.com/invite/ZTGpQJq
Declinazione di responsabilità
Le informazioni e le pubblicazioni non sono intese come, e non costituiscono, consulenza o raccomandazioni finanziarie, di investimento, di trading o di altro tipo fornite o approvate da TradingView. Per ulteriori informazioni, consultare i Termini di utilizzo.