PROTECTED SOURCE SCRIPT
™TradeChartist Fibonacci Plotter

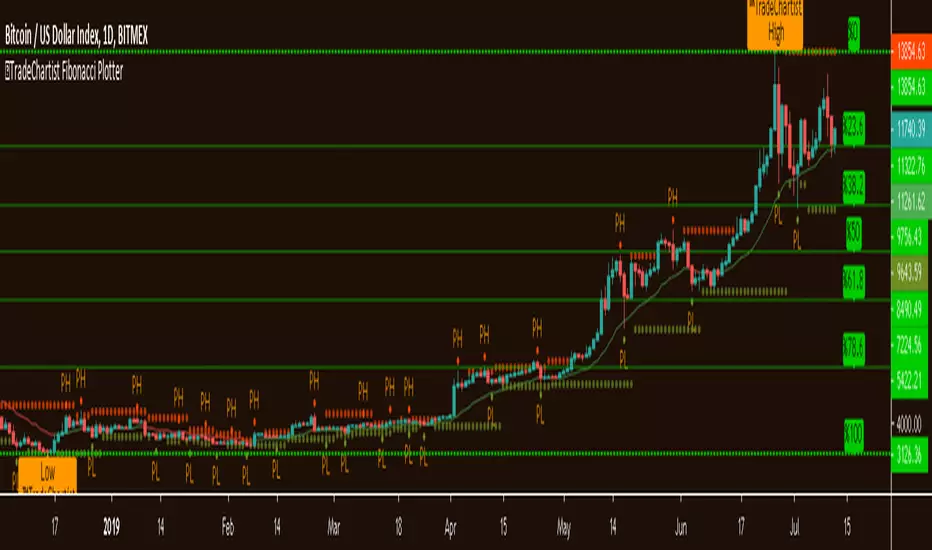
™TradeChartist Fibonacci Plotter is a free and easy to use script to plot Fibonacci levels, 20 EMA (20 period Exponential Moving Average) and Pivot Highs/Lows on any time frame chart on any assets like Stocks, Forex, Commodities, Cryptocurrencies etc.
Fibonacci Levels can be plotted using the following options from settings.
1. Lookback type - Candles
Calculates the High and Low price of the user input number of Candles back (100 default) and plots Fibonacci Levels based on the calculated High and Low for the number of candles in the past from the current candle
2. Lookback type - Days
Calculates the High and Low price of the user input number of Days back (100 default) and plots Fibonacci Levels based on the calculated High and Low for the number of days in the past from the day of the current bar. The levels stay intact on any time frame as long as no new Highs or Lows are formed.
3. Manual Price Input
Plots Fibonacci Levels based on the user specified High and Low Price in the settings input screen. The levels stay intact on any time frame irrespective of new Highs or Lows being formed. Using this option and activating higher Fibonacci Levels like 1.272, 1.414 and 1.618 will enable the trader to keep the Levels intact and set alerts based on static higher levels for trade execution when price crosses beyond 100% retracement. On the other two lookback types, higher levels when activated will move dynamically based on new highs or lows being formed and price will never go beyond 100% level.
Example of Manual Price Input for GBP-USD on 1hr chart with higher levels is shown below:

Also the levels can be reversed by checking "Reverse Fibonacci Levels" from settings (Off by Default)
In addition to the Fibonacci plot, 20 period EMA (On by Default) and Pivot Highs/Lows (On by Default) are coded into the script as optional extras as both of these indicators will help make an informed decision in making trade decisions using Fibonacci Levels.
This is a free to use indicator. Give a thumbs up or leave a comment if you like the script
Check my 'Scripts' page to see other published scripts. Get in touch with me if you would like access to my invite-only scripts for a trial before deciding on a paid access for a period of your choice. Monthly, Quarterly, Half-Yearly and 1 Year access available on invite-only scripts along with 1hr Team Viewer intro session.
Fibonacci Levels can be plotted using the following options from settings.
1. Lookback type - Candles
Calculates the High and Low price of the user input number of Candles back (100 default) and plots Fibonacci Levels based on the calculated High and Low for the number of candles in the past from the current candle
2. Lookback type - Days
Calculates the High and Low price of the user input number of Days back (100 default) and plots Fibonacci Levels based on the calculated High and Low for the number of days in the past from the day of the current bar. The levels stay intact on any time frame as long as no new Highs or Lows are formed.
3. Manual Price Input
Plots Fibonacci Levels based on the user specified High and Low Price in the settings input screen. The levels stay intact on any time frame irrespective of new Highs or Lows being formed. Using this option and activating higher Fibonacci Levels like 1.272, 1.414 and 1.618 will enable the trader to keep the Levels intact and set alerts based on static higher levels for trade execution when price crosses beyond 100% retracement. On the other two lookback types, higher levels when activated will move dynamically based on new highs or lows being formed and price will never go beyond 100% level.
Example of Manual Price Input for GBP-USD on 1hr chart with higher levels is shown below:
Also the levels can be reversed by checking "Reverse Fibonacci Levels" from settings (Off by Default)
In addition to the Fibonacci plot, 20 period EMA (On by Default) and Pivot Highs/Lows (On by Default) are coded into the script as optional extras as both of these indicators will help make an informed decision in making trade decisions using Fibonacci Levels.
This is a free to use indicator. Give a thumbs up or leave a comment if you like the script
Check my 'Scripts' page to see other published scripts. Get in touch with me if you would like access to my invite-only scripts for a trial before deciding on a paid access for a period of your choice. Monthly, Quarterly, Half-Yearly and 1 Year access available on invite-only scripts along with 1hr Team Viewer intro session.
Script protetto
Questo script è pubblicato come codice protetto. Tuttavia, è possibile utilizzarle liberamente e senza alcuna limitazione – ulteriori informazioni qui.
Get in touch with me if you would like access to my Premium scripts for a trial before deciding on lifetime access.
Telegram - @Trade_Chartist
Free Scripts - bit.ly/Free-Scripts
Telegram - @Trade_Chartist
Free Scripts - bit.ly/Free-Scripts
Declinazione di responsabilità
Le informazioni e le pubblicazioni non sono intese come, e non costituiscono, consulenza o raccomandazioni finanziarie, di investimento, di trading o di altro tipo fornite o approvate da TradingView. Per ulteriori informazioni, consultare i Termini di utilizzo.