PROTECTED SOURCE SCRIPT
Aggiornato Cup & Handle Post-Breakout Correction Finder
What This Script Tries to Do (Simple Summary)
Finds a Specific Setup: It looks for stocks that might be getting ready to move up again after a specific sequence:
The Signal: If all these conditions are met, it places a small, bright green circle below the price bar on your chart.
Reference Line: It also shows the 200-period moving average (usually the 200-week, as this script is best on Weekly charts) as a red line.
Best Way to Use It (Simple Guide)
Confirm with Your Eyes & Other Tools:
Manage Risk: If you decide to trade based on this signal (after confirming it), always know where you'll place your stop-loss in case the pattern fails.
Finds a Specific Setup: It looks for stocks that might be getting ready to move up again after a specific sequence:
- A big "Cup & Handle" breakout happened 1-3 years ago.
- The stock then pulled back (corrected) for at least a few months (~4 months by default) without crashing too hard (less than 35% drop by default).
- The main weekly moving averages are now tightly bunched together (suggesting a pause or "squeeze").
- The price just crossed above its 200-day moving average (a potential positive sign).
- The price hasn't already broken above the high point of the recent pullback.
The Signal: If all these conditions are met, it places a small, bright green circle below the price bar on your chart.
Reference Line: It also shows the 200-period moving average (usually the 200-week, as this script is best on Weekly charts) as a red line.
Best Way to Use It (Simple Guide)
- Use on Daily or Weekly Charts: The script's settings (like pullback in weeks) make it more suitable for the Weekly timeframe.
- Look for the Green Circle: This is the main signal that the script found a potential setup matching all its rules.
- Don't Trade Blindly! The green circle is just an alert, not a guaranteed buy signal. It means "This stock might fit the pattern, check it out!".
Confirm with Your Eyes & Other Tools:
- Does the chart look like the pattern the script is searching for (past breakout, recent pullback, current tightening)?
- Switch to the Daily chart to see how the cross above the 200-day EMA looks. Is it clean?
- Check the volume. Is buying interest picking up as the signal appears? (Good sign).
- Consider the overall market trend. Is it a good time to be buying stocks?
- Customize (Optional): You can adjust the settings (gear icon ⚙️) to make the rules stricter or looser (e.g., change the pullback duration, allowed drop percentage, EMA tightness).
Manage Risk: If you decide to trade based on this signal (after confirming it), always know where you'll place your stop-loss in case the pattern fails.
Note di rilascio
*Earlier version was not considering minimum 4 month of correction period after the initial rally.**This version has also been refined to properly identify long term breakouts of 1 to 5 years and not only cup and handle patterns*
New Name: Post Breakout Sangam Finder (PBSF):
Goal: It aims to find specific potential entry points after a stock has already broken out of a long-term high price level.
Sequence: It looks for a specific sequence of events:
- Breakout: The price must first cross above a significant prior high level (defined by the highest point in the last year or the highest point from 1-5 years ago, whichever is greater). Note: If the chart is less than "Older Window Start Period", by default the breakout is calculated from highest high price of last 1 year
- Waiting Period (Age): After the breakout, the script waits for a minimum number of months (default: 6 months) to pass. This ensures the breakout isn't immediately rejected.
- Rally: During or after the waiting period, the script looks for the price to rally significantly higher than the breakout level, reaching a new peak.
- Valid Rally Gain: When the price eventually pulls back from that peak, the script checks if the rally (from breakout level to the peak) was within a specific percentage range (default: 30% to 60%). If the rally was too small or too large, the script resets and waits for a new breakout.
- Correction Duration: If the rally gain was valid, the script then waits for the price to correct (stay below the peak) for a minimum number of months (default: 4 months).
- "Armed" State: Once the breakout is old enough, the rally gain was valid, and the correction has lasted long enough, the script considers the setup "Armed".
- Final Trigger (Sangam): While the setup is "Armed", the script looks for the final confluence ("Sangam"):
- The daily 20, 50, 100, and 200 EMAs must be tightly squeezed together (within a default 5% range of each other).
- The price must cross above the daily 200 EMA.
Optional Lines:
- Older High (Fuchsia): You can optionally display a line showing the highest price from 1 to 5 years ago (default: hidden).
- Recent High (Orange): You can optionally display a line showing the highest price from the last 1 year (default: hidden).
- Daily 200 EMA (Red): You can optionally display the daily 200 EMA line (default: hidden).
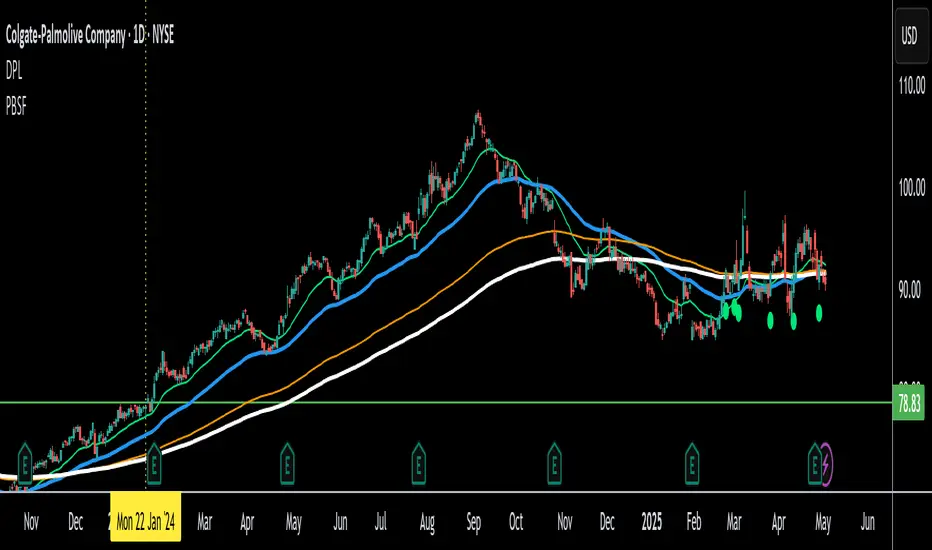
Signal & Alert:
- Green Circle (Signal): A green circle is plotted below the price bar only when all conditions are met simultaneously: the setup is "Armed" (breakout age, rally gain, correction duration are valid) AND the daily EMAs are squeezed AND the price crosses above the daily 200 EMA.
- Alert: An alert will trigger under the exact same conditions that plot the green circle.
Best Way to Use It:
- Timeframe: Designed primarily for the Daily chart, as it specifically requests Daily EMA data.
- Purpose: Use it to identify potential continuation setups after a significant breakout and consolidation period where moving averages are compressing.
- Confirmation: Don't rely solely on the signal. Use it in conjunction with other analysis (volume, chart patterns, overall market trend, fundamental analysis) to confirm potential trades.
- Customization: Adjust the input parameters (lookback periods, gain percentages, durations, squeeze percentage) in the script settings to match the characteristics of the stocks you trade or your specific strategy requirements. Start with the defaults and tweak as needed based on testing.
- Screening: While useful for analyzing individual charts, its real power might come from using it within a TradingView screener (if possible with custom scripts on your plan) to find stocks currently meeting these specific criteria across a larger list.
Script protetto
Questo script è pubblicato come codice protetto. Tuttavia, è possibile utilizzarle liberamente e senza alcuna limitazione – ulteriori informazioni qui.
Declinazione di responsabilità
Le informazioni e le pubblicazioni non sono intese come, e non costituiscono, consulenza o raccomandazioni finanziarie, di investimento, di trading o di altro tipo fornite o approvate da TradingView. Per ulteriori informazioni, consultare i Termini di utilizzo.