PROTECTED SOURCE SCRIPT
Drawdown % + STD Bands: Log-Scale Macro Tool
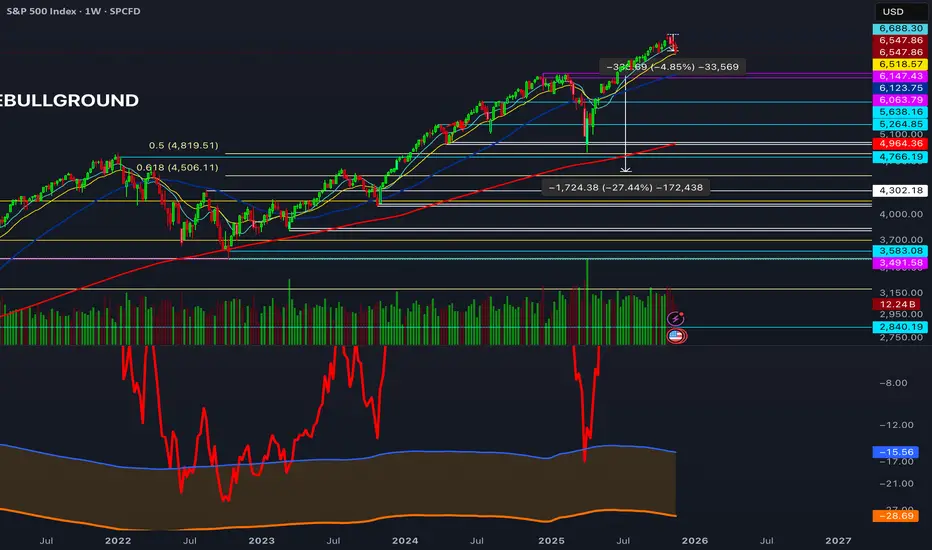
Description: The exact indicator big-macro accounts use: tracks real-time drawdown from the rolling 252-period peak, then plots -1σ (blue) and -2σ (orange) bands on a clean percent scale. Built for weekly charts-shows if a stock, index, or crypto is statistically cheap (hit -1σ) or generational-buy territory (-2σ). Works flawlessly on SPX, Nasdaq, Bitcoin, Gold, Tesla... anything. How to Use (read it aloud like a voice memo): 1. Slap this under any chart, set to weekly timeframe . 2. Flip the price pane to log scale -zero negotiations. 3. Watch the thick red line: • Hovering 0 %? Bullish noise, chill. • Kissing blue (-10 % to -25 %)? Start loading-happens every 1-2 years. • Touching orange (-30 %+)? Panic sale finished. Buy like rent money's burning a hole. 4. Zoom out five-ten years; monthly works too if you want lazy vibes. Daily? Trash-too twitchy. Pro tip: Name your watchlist Panic Plays, drop this in, and ping me when MELI or GOOGL hits orange. I'll confirm if it's actually stupid-cheap.
Script protetto
Questo script è pubblicato come codice protetto. Tuttavia, è possibile utilizzarle liberamente e senza alcuna limitazione – ulteriori informazioni qui.
Declinazione di responsabilità
Le informazioni e le pubblicazioni non sono intese come, e non costituiscono, consulenza o raccomandazioni finanziarie, di investimento, di trading o di altro tipo fornite o approvate da TradingView. Per ulteriori informazioni, consultare i Termini di utilizzo.