PROTECTED SOURCE SCRIPT
Volume Nodes Probability Gauge[VIO]
Volume Nodes Probability Gauge[VIO]
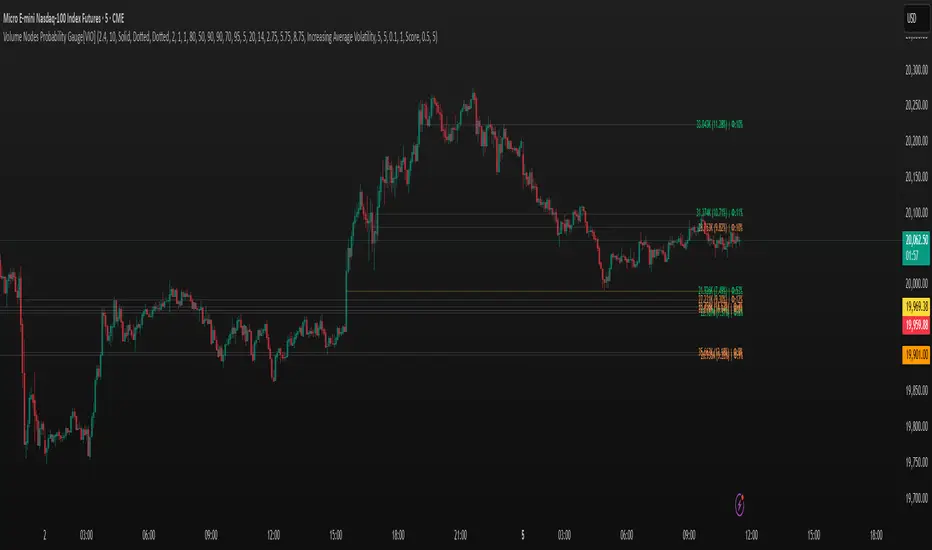
This indicator helps identify and analyze significant volume nodes on the chart. It visualizes the probability of these key price levels holding based on how many times price has interacted with them. Additionally, it provides a dynamic volatility pressure gauge next to nearby volume nodes, offering insight into the current market volatility as price approaches these levels. The indicator also includes customizable alerts for level crossings combined with specific volatility conditions.
Key Features:
Significant Volume Node Identification: Automatically detects price levels with notable volume activity.
Probability Visualization: Displays a probability percentage next to each volume node, which decreases as the level is touched more frequently.
Volatility Pressure Gauge: Shows a visual gauge next to nearby volume nodes, indicating the current volatility pressure (bullish/green or bearish/red) and its intensity.
Customizable Alerts: Set alerts for price crossing significant volume nodes based on increasing/decreasing average volatility, high volatility levels, or any volatility.
Adjustable Sensitivity: Control the strength and number of volume nodes detected.
Customizable Visuals: Configure the appearance of volume nodes based on their "touched" state (Naked, Dirty, Faded).
Okay, I can explain how you might use the "Volume Nodes Probability Gauge[VIO]" indicator in a trading context. The indicator provides several pieces of information that can be combined to inform potential trading decisions.
Here's a breakdown of how to interpret and potentially trade using its features:
Volume Nodes as Support/Resistance:
Interpretation: The core of the indicator is identifying price levels where significant volume has traded in the past. These levels often act as areas of support (where buying pressure might step in) or resistance (where selling pressure might emerge).
Trading Idea: Look for price reactions around these visualized volume nodes.
Long Entry: Consider long positions if price approaches a volume node from above and shows signs of support (e.g., bullish price action, rejection candles).
Short Entry: Consider short positions if price approaches a volume node from below and shows signs of resistance (e.g., bearish price action, rejection candles).
Probability Gauge:
Interpretation: The probability percentage next to each node gives you an idea of how "fresh" or "tested" the level is. A higher percentage (less touches) suggests the level hasn't been heavily traded since it formed, potentially making it a stronger barrier on the first few tests. A lower percentage (more touches) indicates the level has been revisited multiple times, which could mean it's weakening or acting as a magnet.
Trading Idea:
Higher Probability (e.g., 80%+): These "Naked" or "Dirty" levels (0-1 touches) might offer stronger initial reactions. You might look for bounce trades off these levels with tighter stops.
Lower Probability (e.g., < 50%): These "Faded" levels (2+ touches) might be more prone to breaking. You might look for breakout trades through these levels, or anticipate price consolidating around them.
Volatility Pressure Gauge:
Interpretation: This gauge shows the current volatility pressure (increasing/decreasing average volatility) as price gets close to a specific volume node.
Green Gauge (Increasing Average Volatility): Suggests volatility is expanding as price nears the node. This can indicate potential for a strong move or a breakout.
Red Gauge (Decreasing Average Volatility): Suggests volatility is contracting as price nears the node. This might precede consolidation or a less impulsive reaction at the level.
Trading Idea:
Green Gauge at a Node: If price is at a volume node with a green volatility gauge, it could signal an impending breakout or a strong impulsive bounce/rejection. This might increase confidence in a breakout trade (if other factors align) or suggest a potentially volatile reaction if trading a bounce.
Red Gauge at a Node: If price is at a volume node with a red volatility gauge, it might suggest consolidation around the level or a less aggressive reaction. This could be useful for range-bound strategies or anticipating a slower move.
Volatility Crossing Alerts:
Interpretation: These alerts notify you when price crosses a volume node and a specific volatility condition is met (increasing average volatility, high volatility level, or any volatility).
Trading Idea: Use these alerts as potential entry signals or confirmation of a move.
An alert with "Increasing Average Volatility" or "High Volatility Level" when price crosses a node could signal a high-momentum breakout or breakdown.
You can configure the alerts to notify you based on the volatility condition that best suits your trading style.
Combining Signals:
The most effective way to use this indicator is likely by combining the signals. For example:
A high-probability (Naked/Dirty) volume node + price showing rejection + Green Volatility Pressure Gauge could be a strong confluence for a bounce trade.
A low-probability (Faded) volume node + price breaking through + Green Volatility Pressure Gauge could indicate a higher likelihood of a successful breakout trade.
Remember that no indicator is perfect, and it's crucial to use this in conjunction with your overall trading strategy, risk management, and other analysis tools. Experiment with the different input settings to find what works best for the instruments and timeframes you trade.
Script protetto
Questo script è pubblicato come codice protetto. Tuttavia, è possibile utilizzarle liberamente e senza alcuna limitazione – ulteriori informazioni qui.
Declinazione di responsabilità
Le informazioni e le pubblicazioni non sono intese come, e non costituiscono, consulenza o raccomandazioni finanziarie, di investimento, di trading o di altro tipo fornite o approvate da TradingView. Per ulteriori informazioni, consultare i Termini di utilizzo.