OPEN-SOURCE SCRIPT
Aggiornato Hosoda Waves ABC
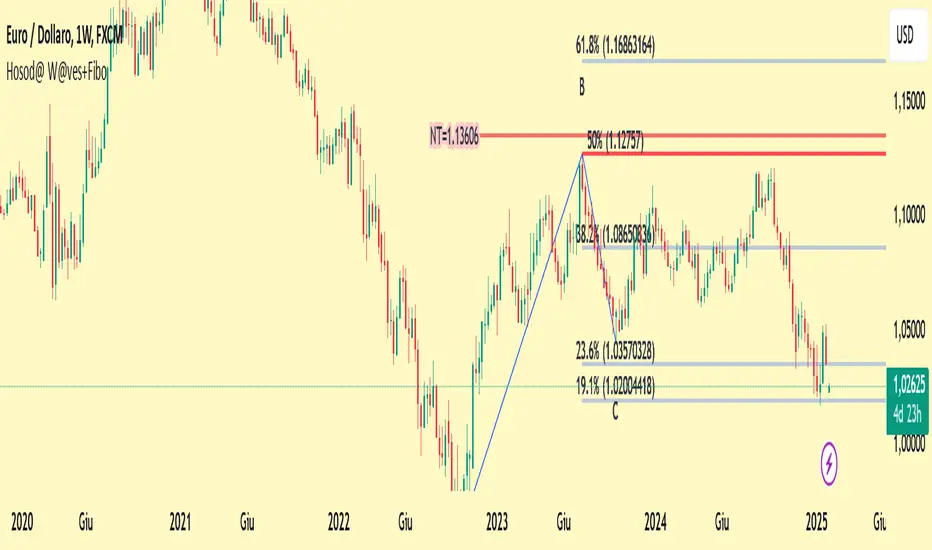
The Hosoda Waves indicator was devised by Goichi Hosoda, the creator of the Ichimoku system, with the idea that previous highs and lows could determine future price ranges to which the market would react. Hosoda's projections include the NT, N, V, and E waves, derived from calculations based on both upward and downward ABC swings. The calculations for Hosoda's waves are as follows:
NT Wave = C + (C - A)
N Wave = B + (B - A)
V Wave = B + (B - C)
E Wave = C + (B - A)
This indicator visually represents the calculations by Hosoda. Additionally, Hosoda indicated time cycles: 9, 17, 26, 33, 42, 51, 65, 76, etc., which are not integrated into this indicator as they are not considered effective in contemporary times.
Once applied to the chart, the interactive Pine Script tool version 5 will prompt you to identify 3 points of "low-high-low" or "high-low-high," both for upward and downward movements. Once clicked, these price points can be moved. If you change the time frame or market instrument, the indicator must be removed because it remains tied to the prices where it was initially drawn.
Note di rilascio
This work is a version of my Hosoda Waves ABC to which Fibonacci retracements, as I position them, have been added. Unusual Fibonacci values derived from my studies, which include some Gann theories, may be noticed. This version also features alerts on the NT, N, and E lines of HosodaScript open-source
In pieno spirito TradingView, il creatore di questo script lo ha reso open-source, in modo che i trader possano esaminarlo e verificarne la funzionalità. Complimenti all'autore! Sebbene sia possibile utilizzarlo gratuitamente, ricorda che la ripubblicazione del codice è soggetta al nostro Regolamento.
Declinazione di responsabilità
Le informazioni ed i contenuti pubblicati non costituiscono in alcun modo una sollecitazione ad investire o ad operare nei mercati finanziari. Non sono inoltre fornite o supportate da TradingView. Maggiori dettagli nelle Condizioni d'uso.
Script open-source
In pieno spirito TradingView, il creatore di questo script lo ha reso open-source, in modo che i trader possano esaminarlo e verificarne la funzionalità. Complimenti all'autore! Sebbene sia possibile utilizzarlo gratuitamente, ricorda che la ripubblicazione del codice è soggetta al nostro Regolamento.
Declinazione di responsabilità
Le informazioni ed i contenuti pubblicati non costituiscono in alcun modo una sollecitazione ad investire o ad operare nei mercati finanziari. Non sono inoltre fornite o supportate da TradingView. Maggiori dettagli nelle Condizioni d'uso.