Enhanced Autocorrelation Periodogram RasterChart - Ehlers
Understand all of the above aforementioned? Proceed...
For those of you wondering how I did it without Pine support for arrays, I had to emulate them, totaling over 600+ lines of code. This was a formidable task to achieve. This may be the hardest task I have ever accomplished, as of yet, in Pine.
Now, on to the Description...
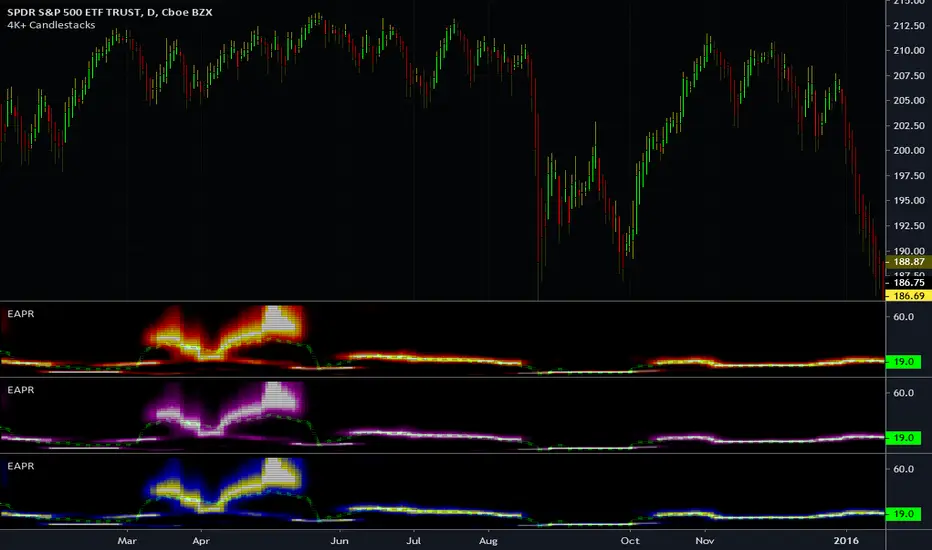
This is my enhanced and heavily* modified version of Dr. John Ehlers' autocorellation periodogram for detecting dominant cycles(frequencies) in an asset using Pine Script version 4.0. The original concept comes from chapter 8 of his book "Cycle Analytics for Traders" and may also be found in TASC magazine in the September 2016 issue. I did heavily modify the original computations for the purpose of providing the "maximum" amount of adjustability there is to possibly offer, but left the original settings intact. I also provided an assortment of vibrant color changing techniques to choose from for anyone who may have vision impairments. This also displays that color scheming is VERY possible in Pine ...if only I could get "chart.theme" for auto-detection.
I once again would personally like to thank the talented individuals at TV for providing a platform that embraces an initial free membership, which I first obtained myself, for individuals like me to freely code in Pine with mathemagical ideas and mental wizardry, creating ultimately, inventions like this eye candy display above.
Features List Includes:
"Source" Selection
Color schemes (displayed above)
Transparency for the heat map to reduce or intensify color brightness ( Thank you TV! For this feature...)
The detected dominant cycle can be 'Sourced' by another specially** modified script providing an integer, float, or a rounded float.
Resolution enhancement has 3 settings
Smoother period control
Highpass period control
Pearson correlation period control
Minimal Power Threshold Tweak(Experimental***)
Adjustment for the smoothing coefficients of the Fourier Transforms(Experimental!)
This is not a freely available indicator, FYI. To witness my Pine poetry in action, properly negotiated requests for unlimited access, per indicator, may ONLY be obtained by direct contact with me using TV's "Private Chats" or by "Message" in my member name above. The comments section below is solely just for commenting and other remarks, ideas, compliments, etc... If you do have any questions or comments regarding this indicator, I will consider your inquiries, thoughts, and ideas presented below in the comments section, when time provides it. As always, "Like" it if you simply just like it, and also return to my scripts list occasionally for additional postings. Have a profitable future everyone!
* This has additional features/tweaks not included in the original.
** Many Pine built-in functions WILL NOT support the use of this detector if 'Sourced' to control a period setting. You have to totally rewrite those built-in Pine functions in Pine script. Yes, it is very possible! BUT ...in many cases, not all.
*** This "modification" reduces large spikes in the detected dominant cycle period with increased adjustment. Increasing this value may reduce dominant cycle spikes around 0.3-ish
Refactored/optimized code improving efficiency
Added additional smoothing algorithm for the Fourier transforms
Cleaned up Settings
Script su invito
Solo gli utenti autorizzati dall'autore hanno accesso a questo script e ciò richiede solitamente un pagamento. Puoi aggiungere lo script ai tuoi preferiti, ma potrai utilizzarlo solo dopo aver richiesto l'autorizzazione e averla ottenuta dal suo autore - per saperne di più leggi qui. Per maggiori dettagli, segui le istruzioni dell'autore qui sotto o contatta direttamente ImmortalFreedom.
TradingView NON consiglia di pagare o utilizzare uno script a meno che non ci si fidi pienamente del suo autore e non si comprenda il suo funzionamento. Puoi anche trovare alternative gratuite e open-source nei nostri script della comunità.
Istruzioni dell'autore
Attenzione: prima di richiedere l'accesso, leggi la nostra guida per gli script su invito.
Declinazione di responsabilità
Script su invito
Solo gli utenti autorizzati dall'autore hanno accesso a questo script e ciò richiede solitamente un pagamento. Puoi aggiungere lo script ai tuoi preferiti, ma potrai utilizzarlo solo dopo aver richiesto l'autorizzazione e averla ottenuta dal suo autore - per saperne di più leggi qui. Per maggiori dettagli, segui le istruzioni dell'autore qui sotto o contatta direttamente ImmortalFreedom.
TradingView NON consiglia di pagare o utilizzare uno script a meno che non ci si fidi pienamente del suo autore e non si comprenda il suo funzionamento. Puoi anche trovare alternative gratuite e open-source nei nostri script della comunità.
Istruzioni dell'autore
Attenzione: prima di richiedere l'accesso, leggi la nostra guida per gli script su invito.