PROTECTED SOURCE SCRIPT
Multi-Timeframe 5 EMA Static (1m,5m,15m,1h,4h,1D)
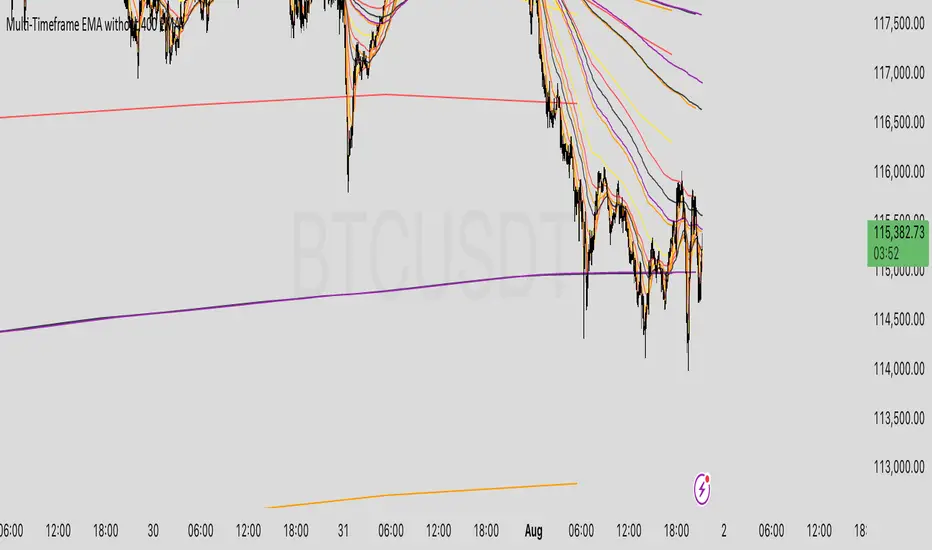
Indicator Description: Multi-Timeframe EMA with Consistent Colors
This indicator plots Exponential Moving Averages (EMAs) of varying lengths on a chart across multiple timeframes. It provides traders with the ability to visualize key EMAs for different lengths and timeframes simultaneously, offering perspective on trends and support/resistance levels across multiple timeframes.
This script includes 5 EMAs (8 EMA, 21 EMA, 50 EMA, 200 EMA, and 800 EMA) and covers the following timeframes:
1-Minute
5-Minute
15-Minute
1-Hour
4-Hour
Daily
Key Features:
1. Multi-Timeframe Analysis:
The indicator calculates and displays EMAs for 6 distinct timeframes, enabling traders to spot trend dynamics, reversals, or price action alignment between lower and higher timeframes.
2. Consistent Colors:
Each EMA length is assigned a unique color across all timeframes, making it easy to identify and compare:
8 EMA: Yellow — Short-term moving average that reflects immediate price trends.
21 EMA: Dark Red — Useful for identifying short-term supportive/resistance levels and trends across timeframes.
50 EMA: Orange — Mid-range trend-following line, helpful for swing trading.
200 EMA: Black — Long-term trend measure, widely regarded as a critical line for defining market direction.
800 EMA: Violet — Ultra-long-term trend used by advanced traders for significant macro analysis.
3. EMA Calculation Based on Candle Close:
EMAs are calculated using the closing prices of candles for the respective timeframe.
Example: The 1-Minute EMA reflects price movements on every 1-minute candle close, whereas the Daily EMA reflects price movements on the daily timeframe's candle close.
4. Visual Representation:
All EMAs are plotted as smooth lines using , ensuring a clean and continuous visualization of trends.
Use Cases:
1. Trend Identification:
Lower timeframe EMAs (e.g., 8 EMA on 1-Min) reveal short-term price movements.
Higher timeframe EMAs (e.g., 200 EMA on Daily) represent macro trends, enabling traders to align their trades with larger market structures.
2. Dynamic Support and Resistance:
50 EMA and 200 EMA act as common support and resistance levels across multiple timeframes.
Traders can evaluate zones of confluence where prices interact across different timeframe EMAs.
3. Cross-Timeframe Analysis:
By spotting price alignment and interactions with EMAs across timeframes, traders can make more informed decisions about entries, exits, and trend reversals.
For example: If price is breaking above the 800 EMA on multiple timeframes, it signals a potentially major bullish move.
Why Use This Indicator?
1. Timeframe-Specific Precision:
This indicator provides precise EMA calculations tied to their specific timeframes. For example:
The 1-Minute EMA for each length shows rapid short-term price trends.
The Daily EMA for each length tracks slow-moving trends over time.
This allows traders to analyze price action both locally and globally.
2. Consistent Color Coding Across Timeframes:
The uniform coloring of EMA lengths ensures clarity and consistency during analysis. Traders can easily spot common EMA levels (e.g., 50 EMA) across multiple timeframes.
3. Support for Scalping, Swing Trading, and Long-Term Analysis:
Whether you're a scalper focusing on 1-Minute trends or a swing trader targeting Daily trends, this indicator helps align decisions across different timeframes.
How the Indicator Works:
1. Calculation Logic:
EMAs are calculated dynamically using the function, which fetches data for each specific timeframe, allowing the chart to overlay all timeframe calculations accurately. For example:
8 EMA on 5-Minute timeframe calculates the EMA based on the closing prices of the 5-Minute candles.
2. Plotting Logic:
The indicator plots all EMAs with a unique color and label for easy differentiation. For instance, each EMA (e.g., 8 EMA) is consistently displayed in the same color (Yellow) across all timeframes.
3. Line Style:
All EMAs are displayed using the setting to ensure smooth and continuous lines on the chart.
Example Visualization:
Imagine the chart with:
Yellow 8 EMA across all timeframes showing rapid, short-term trends.
Orange 50 EMA showing mid-level trends and acting as dynamic support/resistance across 1-Minute, 15-Minute, and Daily candles.
Black 200 EMA clearly defining long-term market direction for all timeframes.
Traders can identify confluence zones where the price interacts with multiple timeframe EMAs, offering actionable signals.
Indicator Parameters:
Included Timeframes:
1-Minute
5-Minute
15-Minute
1-Hour
4-Hour
Daily
Included EMA Lengths:
8 EMA
21 EMA
50 EMA
200 EMA
800 EMA
How to Use This Indicator:
Add the Pine Script Code to the TradingView Pine Script Editor.
Click "Add to Chart".
Observe EMAs calculated for:
Lengths: 8, 21, 50, 200, 800.
Timeframes: 1-Min, 5-Min, 15-Min, 1-Hour, 4-Hour, Daily.
Use consistent colors to spot interactions, trends, and confluence zones across timeframes.
Summary:
This indicator is ideal for traders wishing to analyze trends, support/resistance levels, and market alignment across multiple timeframes while maintaining clarity through consistent EMA color coding. It serves scalpers, swing traders, and long-term strategists by bridging short-term price action with broader market behavior.
Script protetto
Questo script è pubblicato come codice protetto. Tuttavia, è possibile utilizzarle liberamente e senza alcuna limitazione – ulteriori informazioni qui.
Declinazione di responsabilità
Le informazioni e le pubblicazioni non sono intese come, e non costituiscono, consulenza o raccomandazioni finanziarie, di investimento, di trading o di altro tipo fornite o approvate da TradingView. Per ulteriori informazioni, consultare i Termini di utilizzo.