OPEN-SOURCE SCRIPT
Aggiornato Enhanced Gann Time-Price Squares
Enhanced Gann Time-Price Squares Indicator
A comprehensive Pine Script indicator that identifies and visualizes W.D. Gann's time-price square formations on your charts. This tool helps traders spot potential market turning points where time and price movements align according to Gann's legendary market theories.
Key Features:
Automatic Square Detection - Identifies completed squares where price movement equals time movement
Future Projections - Shows forming squares with projected completion points
Pivot Integration - Automatically detects pivot highs/lows as square starting points
Visual Clarity - Clean box outlines with customizable colors and styles
Smart Filtering - Prevents overlapping squares and includes minimum move thresholds
Real-time Status - Information table showing current square formations
How to Use:
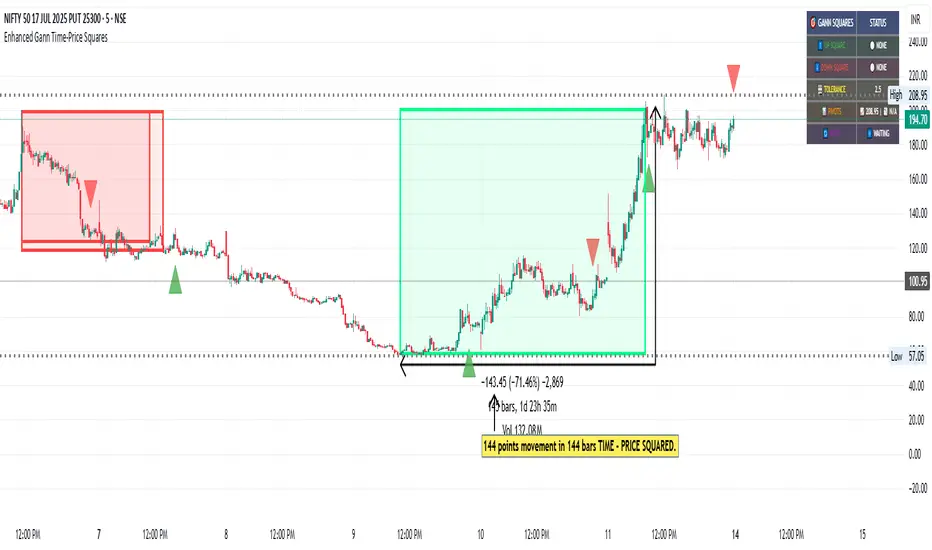
The indicator draws boxes when price moves from pivot points equal the time elapsed (number of bars). Green squares indicate upward movements, red squares show downward movements. Dashed lines show forming squares, while dotted lines project where they might complete.
Settings:
Adjust pivot sensitivity and minimum price moves
Customize tolerance for time-price matching
Toggle projections, labels, and visual elements
Fine-tune colors and line styles
Perfect for Gann theory practitioners and traders looking for time-based market analysis. The squares often coincide with significant support/resistance levels and potential reversal points.
Compatible with all timeframes and instruments.
More updates to follow
A comprehensive Pine Script indicator that identifies and visualizes W.D. Gann's time-price square formations on your charts. This tool helps traders spot potential market turning points where time and price movements align according to Gann's legendary market theories.
Key Features:
Automatic Square Detection - Identifies completed squares where price movement equals time movement
Future Projections - Shows forming squares with projected completion points
Pivot Integration - Automatically detects pivot highs/lows as square starting points
Visual Clarity - Clean box outlines with customizable colors and styles
Smart Filtering - Prevents overlapping squares and includes minimum move thresholds
Real-time Status - Information table showing current square formations
How to Use:
The indicator draws boxes when price moves from pivot points equal the time elapsed (number of bars). Green squares indicate upward movements, red squares show downward movements. Dashed lines show forming squares, while dotted lines project where they might complete.
Settings:
Adjust pivot sensitivity and minimum price moves
Customize tolerance for time-price matching
Toggle projections, labels, and visual elements
Fine-tune colors and line styles
Perfect for Gann theory practitioners and traders looking for time-based market analysis. The squares often coincide with significant support/resistance levels and potential reversal points.
Compatible with all timeframes and instruments.
More updates to follow
Note di rilascio
Script updated with following ,1)1. Extended Pivot Lookback Range:
Extended from 50 to 200 - Now allows much longer lookback periods for pivot detection.
2)Additional enhancements done to the table for better visulaizations along with additional features like perfomance monitoring,situation awarenessrealtime decision support etc..
3)Automatically Cleans old chart buffer to avoid overlapping of formed squares
Check and share your comments.Cheers!!
Note di rilascio
Enhanced Gann Time-Price Squares Script:This Pine Script implements W.D. Gann's geometric market theory by identifying when price and time movements achieve mathematical balance, creating powerful trading signals at market equilibrium points.
Core Mechanism
The Square Concept: A "square" forms when the distance price moves from a pivot point equals the time (in bars) it takes to make that move. This creates a geometric relationship that Gann believed reveals natural market cycles.
Mathematical Foundation:
Price Movement = Current Price - Pivot Price
Time Movement = Current Bar - Pivot Bar
Square Condition = |Price Movement - Time Movement| ≤ Tolerance
Step-by-Step Process
Pivot Detection:
Scans price action using configurable lookback periods
Identifies confirmed highs and lows that won't change (anti-repainting)
Only processes pivots after confirmation period to ensure reliability
Square Monitoring:
Upward Squares: Tracks price rising from pivot lows
Downward Squares: Tracks price falling from pivot highs
Continuously calculates price/time ratios for active pivots
Formation States:
Forming: Square is developing but not yet complete
Complete: Perfect or near-perfect price-time balance achieved
Projected: Shows where forming squares might complete
Visual Components
Completed Squares: Solid rectangles drawn from pivot to completion point
Green boxes for upward squares (bullish completions)
Red boxes for downward squares (bearish completions)
Forming Squares: Dashed lines showing current progress
Updates in real-time as squares develop
Shows partial completion status
Future Projections: Dotted lines predicting completion zones
Calculates where price should be when square completes
Provides early warning of potential reversal points
Information Dashboard: Real-time metrics including:
Completion percentages for active squares
Price and time movement values
Efficiency ratings (how closely movements align)
Last pivot levels for reference
Advanced Features
Anti-Repainting Protection:
Uses confirmed bar data to prevent signals from changing
Offers "bar close only" updates vs. real-time updates
Requires minimum confirmation bars before showing projections
Performance Optimization:
Memory management to handle long trading sessions
Overlap prevention to avoid cluttered displays
Configurable cleanup frequencies
Strength Analysis:
Measures how precisely price and time movements align
Filters weak formations from strong geometric relationships
Provides confidence levels for each square
Trading Applications
Reversal Signals: Completed squares often mark trend exhaustion points where price direction changes
Price Targets: Forming squares provide objective targets based on geometric relationships rather than subjective analysis
Market Timing: Projections help time entries by showing when squares are likely to complete
Risk Management: Failed square formations provide clear invalidation levels for trade management
Configuration Options
Sensitivity Controls: Adjust tolerance levels and minimum move requirements to filter noise
Visualization Settings: Customize colors, line styles, and transparency for different market conditions
Alert System: Notifications for square completions, formations, and high-strength signals
Performance Tuning: Optimize processing frequency and memory usage for different trading styles
Why It Works
Market Psychology: Traders subconsciously recognize geometric balance points, creating self-fulfilling prophecies
Natural Cycles: Gann believed markets follow mathematical laws, with squares representing cycle completions
Equilibrium Points: Equal price/time movements suggest balance between buying and selling pressure, often preceding significant moves
This indicator transforms Gann's classical geometric theories into a practical, automated trading tool that identifies high-probability reversal and continuation points based on natural market mathematics.
Note di rilascio
Script updated: More Robust,Minimized repainting,Gann angles plotting reference improved etcNote di rilascio
Error corrected and updatedScript open-source
Nello spirito di TradingView, l'autore di questo script lo ha reso open source, in modo che i trader possano esaminarne e verificarne la funzionalità. Complimenti all'autore! Sebbene sia possibile utilizzarlo gratuitamente, ricordiamo che la ripubblicazione del codice è soggetta al nostro Regolamento.
Declinazione di responsabilità
Le informazioni e le pubblicazioni non sono intese come, e non costituiscono, consulenza o raccomandazioni finanziarie, di investimento, di trading o di altro tipo fornite o approvate da TradingView. Per ulteriori informazioni, consultare i Termini di utilizzo.
Script open-source
Nello spirito di TradingView, l'autore di questo script lo ha reso open source, in modo che i trader possano esaminarne e verificarne la funzionalità. Complimenti all'autore! Sebbene sia possibile utilizzarlo gratuitamente, ricordiamo che la ripubblicazione del codice è soggetta al nostro Regolamento.
Declinazione di responsabilità
Le informazioni e le pubblicazioni non sono intese come, e non costituiscono, consulenza o raccomandazioni finanziarie, di investimento, di trading o di altro tipo fornite o approvate da TradingView. Per ulteriori informazioni, consultare i Termini di utilizzo.