OPEN-SOURCE SCRIPT
Open Interest Suite [Aggregated] - By Leviathan
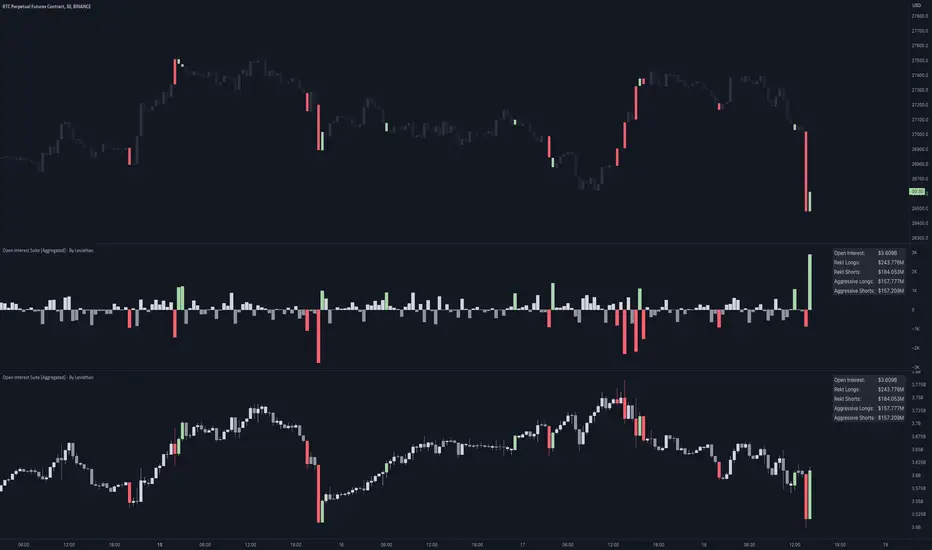
This script is an all-in-one indicator that uses aggregated Open Interest data to plot OI candles, Open Interest Delta, OI x rVOL, and OI RSI. It also includes tools such as an OI Distribution profile, large OI increase/decrease coloring, a Stats Screener, and much more.
You can select and have the script plot the following:
- Open Interest in the form of OHLC candles
- Open Interest Delta in the form of a histogram
- Open Interest x Relative Volume in the form of a histogram
- Open Interest RSI in the form of a line
Additional features include:
- OI Distribution Profile (It shows the distribution of open interest in the visible range on y axis. This makes it easier to identify when Open Interest is relatively high or low and at which values most of the action took place)
- Stats screener (The screener includes the real-time net Open Interest value, Rekt Longs/Rekt Shorts based on large OI decreases and Aggressive Longs/Shorts based on large OI increases)
- Coloring (You can color OI Delta nodes, background and chart candles based on large OI increases/decreases)
- more
Instructions for the settings will be provided in the tooltips shortly.
Full credit goes to KioseffTrading for the profile generation code.
Script open-source
Nello spirito di TradingView, l'autore di questo script lo ha reso open source, in modo che i trader possano esaminarne e verificarne la funzionalità. Complimenti all'autore! Sebbene sia possibile utilizzarlo gratuitamente, ricordiamo che la ripubblicazione del codice è soggetta al nostro Regolamento.
Declinazione di responsabilità
Le informazioni e le pubblicazioni non sono intese come, e non costituiscono, consulenza o raccomandazioni finanziarie, di investimento, di trading o di altro tipo fornite o approvate da TradingView. Per ulteriori informazioni, consultare i Termini di utilizzo.