PROTECTED SOURCE SCRIPT
Aggiornato Stock Bee's 4%
Stock Bee's 4%
First Things First
- This indicator is a replica of Pradeep Bonde aka Stock Bee’s 4% indicator which he uses in the TC2000 platform for trading momentum burst and EP 9 million setup.
- Disclaimer: This indicator will not give any buy or sell signal. This is just a supporting tool to improve efficiency in my trading.
- Apply Indicators and then open indicator settings and read the following simultaneously to understand better.
- Default color settings are best suited for light themes. Which is also my personal preference.
- Users can change most of the default options in settings according to their personal preference in settings.
- When we open settings we can see 3 tabs that are {Inputs tab} {Style tab} {Visibility tab} each tab have its own options, Understand and use it accordingly.
- Background Color grading that is “Green” background means parameter favorable, “Red” not favorable for my trading.
- Indicator will be only visible in the Daily time frame as its primary TF is daily. In the lower time frame nothing is plotted.
- An indicator is plotted on a different plane and does not overlay in the existing plane.
Contents
+4% BO
-4% BO
Volume
+4% BO
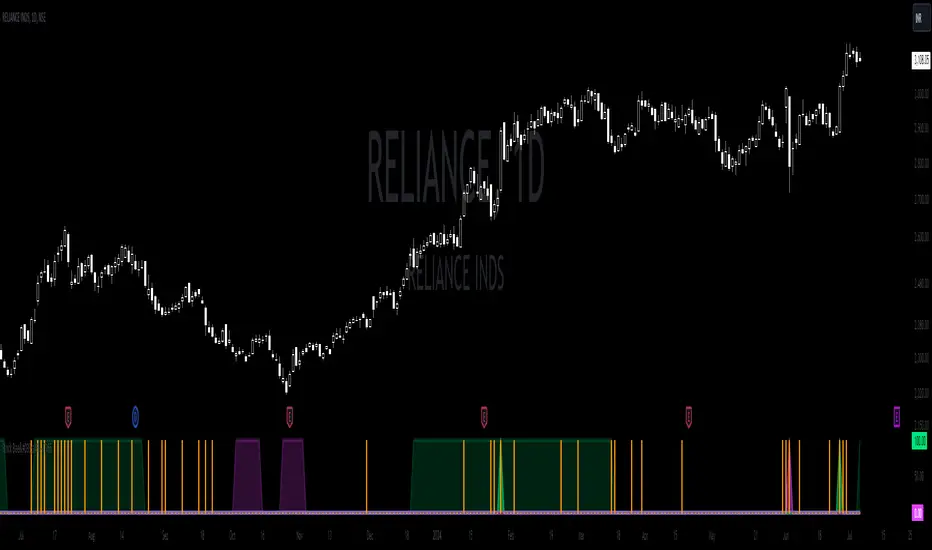
- If the %change is more than 4% and today's volume > yesterday's volume and volume > 100000 then the green line is plotted from 0 to 1.
- This helps in trading momentum burst setup and to spot 4% BO easily.
{Style Tab}
- “Check Mark” Users can Show/Hide the line.
- “+4% BO” Default “Green color”. Users have the option to change.
- “Line Type” Default settings, Users have the option to change.
-4% BO
If the %change is less than -4% and today's volume > yesterday's volume and volume > 100000 then the green line is plotted from 0 to 1.
This helps in trading momentum burst setup and to spot -4% BO easily.
{Style Tab}
- “Check Mark” Users can Show/Hide the line.
- “-4% BO” Default “Red color”. Users have the option to change.
- “Line Type” Default settings, Users have the option to change.
Volume
- If Today’s Volume is greater than Default settings that is 9 Million then Blue color line is plotted similar to +/-4% B) however if u want to plot like Pradeep Bonde aka Stock Bee style then user have to change settings from “line” type to “histogram” type in style tab of settings.
- This is used for spotting EP 9 Million setup.
{Input Tab}
- “Volume” Default is (9). Users have the option to change as per their preference. And the number should be in millions.
{Style Tab}
- “Check Mark” Users can Show/Hide the line.
- “Volume” Default ”Blue color”. Users have the option to change.
- “Line Type” Default settings, Users have the option to change.
To use it similar to Stock Bee, change “Line” to “Histogram”.
Highly Recommended Setting to change immediately
{Style Tab} Outputs Section
“Check Mark” Labels on price scale. “Uncheck it”.
“Check Mark” Values in Status Line. “Uncheck it”.
*****
First Things First
- This indicator is a replica of Pradeep Bonde aka Stock Bee’s 4% indicator which he uses in the TC2000 platform for trading momentum burst and EP 9 million setup.
- Disclaimer: This indicator will not give any buy or sell signal. This is just a supporting tool to improve efficiency in my trading.
- Apply Indicators and then open indicator settings and read the following simultaneously to understand better.
- Default color settings are best suited for light themes. Which is also my personal preference.
- Users can change most of the default options in settings according to their personal preference in settings.
- When we open settings we can see 3 tabs that are {Inputs tab} {Style tab} {Visibility tab} each tab have its own options, Understand and use it accordingly.
- Background Color grading that is “Green” background means parameter favorable, “Red” not favorable for my trading.
- Indicator will be only visible in the Daily time frame as its primary TF is daily. In the lower time frame nothing is plotted.
- An indicator is plotted on a different plane and does not overlay in the existing plane.
Contents
+4% BO
-4% BO
Volume
+4% BO
- If the %change is more than 4% and today's volume > yesterday's volume and volume > 100000 then the green line is plotted from 0 to 1.
- This helps in trading momentum burst setup and to spot 4% BO easily.
{Style Tab}
- “Check Mark” Users can Show/Hide the line.
- “+4% BO” Default “Green color”. Users have the option to change.
- “Line Type” Default settings, Users have the option to change.
-4% BO
If the %change is less than -4% and today's volume > yesterday's volume and volume > 100000 then the green line is plotted from 0 to 1.
This helps in trading momentum burst setup and to spot -4% BO easily.
{Style Tab}
- “Check Mark” Users can Show/Hide the line.
- “-4% BO” Default “Red color”. Users have the option to change.
- “Line Type” Default settings, Users have the option to change.
Volume
- If Today’s Volume is greater than Default settings that is 9 Million then Blue color line is plotted similar to +/-4% B) however if u want to plot like Pradeep Bonde aka Stock Bee style then user have to change settings from “line” type to “histogram” type in style tab of settings.
- This is used for spotting EP 9 Million setup.
{Input Tab}
- “Volume” Default is (9). Users have the option to change as per their preference. And the number should be in millions.
{Style Tab}
- “Check Mark” Users can Show/Hide the line.
- “Volume” Default ”Blue color”. Users have the option to change.
- “Line Type” Default settings, Users have the option to change.
To use it similar to Stock Bee, change “Line” to “Histogram”.
Highly Recommended Setting to change immediately
{Style Tab} Outputs Section
“Check Mark” Labels on price scale. “Uncheck it”.
“Check Mark” Values in Status Line. “Uncheck it”.
*****
Note di rilascio
Now Users can choose desired % in settings.Note di rilascio
Default color settings of marker changed.Note di rilascio
Changes made are,1. Renamed Indicator to stock bee's 4% + TI65
2. Added Trend Intensity65
- This helps of the stock is trending or not based on last 3 months action.
- This compare average close in 7 days to close of 65 and if its more than 5% then it colors green for that specific period.
- This compare average close in 7 days to close of 65 and if its less than -5% then it colors fuchsia for that specific period.
- Users have option to show it or not.
3. Look and feel of settings
Note di rilascio
Minor internal changes.Note di rilascio
New Feature Added,1. Sensitivity option for TI65
2. To Combine Volume in 4% Up and 4% Down
And minor Fixes in internal code.
Note di rilascio
Minor Default settings changed.Script protetto
Questo script è pubblicato come codice protetto. Tuttavia, è possibile utilizzarle liberamente e senza alcuna limitazione – ulteriori informazioni qui.
Declinazione di responsabilità
Le informazioni e le pubblicazioni non sono intese come, e non costituiscono, consulenza o raccomandazioni finanziarie, di investimento, di trading o di altro tipo fornite o approvate da TradingView. Per ulteriori informazioni, consultare i Termini di utilizzo.
Script protetto
Questo script è pubblicato come codice protetto. Tuttavia, è possibile utilizzarle liberamente e senza alcuna limitazione – ulteriori informazioni qui.
Declinazione di responsabilità
Le informazioni e le pubblicazioni non sono intese come, e non costituiscono, consulenza o raccomandazioni finanziarie, di investimento, di trading o di altro tipo fornite o approvate da TradingView. Per ulteriori informazioni, consultare i Termini di utilizzo.