OPEN-SOURCE SCRIPT
Aggiornato Comparative Relative Strength of a stock
Perform comparative relative strength of a stock. Default base is NIFTY 50.
Note di rilascio
Cosmetic changes to make the display pretty and input choices in more logical sequence.Note di rilascio
Added input as source. Some cosmetic changes.Note di rilascio
- version 5
- Added color code for CRS moving average
A color-based trend on the Ratio moving average. The trend lookback is configurable.
Note di rilascio
- Possible to plot candles, of ratio chart, instead of line chart only.
Note di rilascio
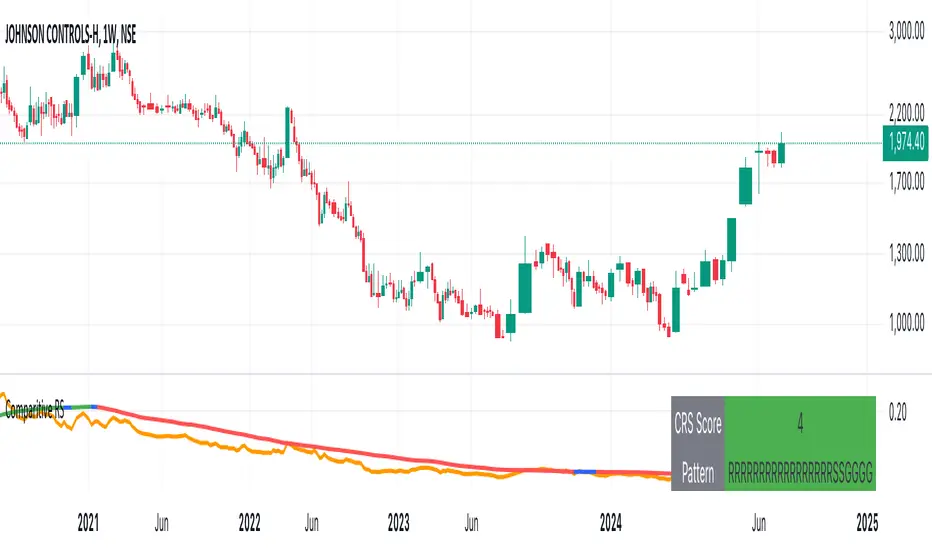
Updated to include a "CRS Score" and "CRS Pattern"- CRS Score: The number of consecutive bars, when the trend of the relative strength is increasing/decreasing. If CRS is falling, score will be negative, if rising, score will be positive and 0 if it is neither positive nor negative (blue)
- CRS Pattern: The pattern of the last 23 (default) bars for the CRS Trend.
If say, the CRS Pattern is RRRRRRRRRSSGG - It means that after 11 bars, the strength is now positive for last 2 bars. This is a good way to visualise a turn around in relative strength of the stock. Higher the number of opposite trend the greater that chance of the reversal.
Script open-source
Nello spirito di TradingView, l'autore di questo script lo ha reso open source, in modo che i trader possano esaminarne e verificarne la funzionalità. Complimenti all'autore! Sebbene sia possibile utilizzarlo gratuitamente, ricordiamo che la ripubblicazione del codice è soggetta al nostro Regolamento.
Declinazione di responsabilità
Le informazioni e le pubblicazioni non sono intese come, e non costituiscono, consulenza o raccomandazioni finanziarie, di investimento, di trading o di altro tipo fornite o approvate da TradingView. Per ulteriori informazioni, consultare i Termini di utilizzo.