OPEN-SOURCE SCRIPT
Aggiornato Fundamental Screener

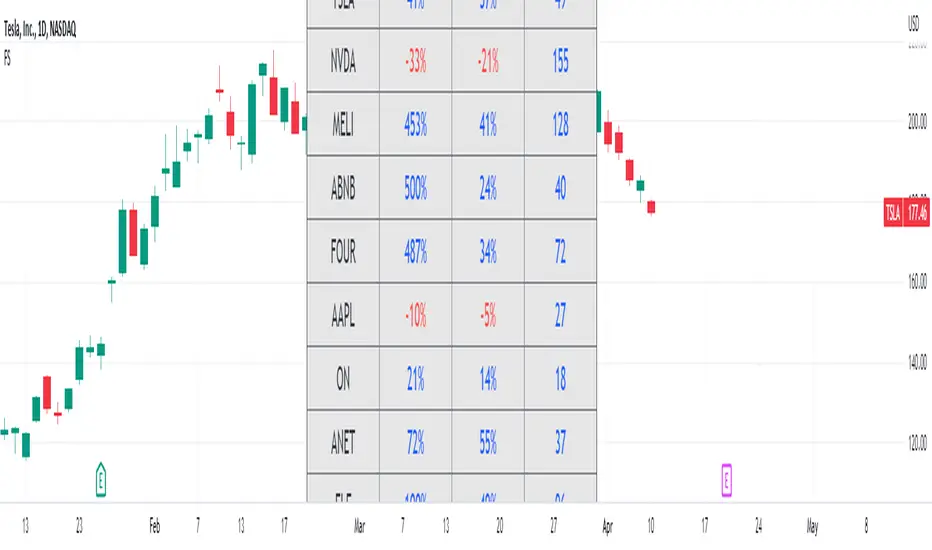
This indicator is designed to compare the year-over-year earnings and sales growth, as well as the P/E ratio of up to 10 stocks simultaneously.
This provides valuable insights into the fundamental performance of multiple stocks at the same time, allowing traders to quickly identify which stocks are outperforming or underperforming their peers.
The earnings and sales growth figures are calculated on a year-over-year basis, comparing the most recent quarter to the same quarter 1 year ago.
The P/E ratio is a valuation metric that measures a company's stock price relative to its trailing twelve months earnings per share.
By comparing these three key metrics across multiple stocks, traders can quickly identify which stock in a group has superior fundamentals.
Customization
- Chose to compare 5 or 10 symbols
- Table position, color, and size
Note di rilascio
Changed table size for picture code for indicator picture. Reverted back to correct codeNote di rilascio
...Script open-source
Nello spirito di TradingView, l'autore di questo script lo ha reso open source, in modo che i trader possano esaminarne e verificarne la funzionalità. Complimenti all'autore! Sebbene sia possibile utilizzarlo gratuitamente, ricordiamo che la ripubblicazione del codice è soggetta al nostro Regolamento.
Trusted Pine programmer. Send me a message for script development.
Declinazione di responsabilità
Le informazioni e le pubblicazioni non sono intese come, e non costituiscono, consulenza o raccomandazioni finanziarie, di investimento, di trading o di altro tipo fornite o approvate da TradingView. Per ulteriori informazioni, consultare i Termini di utilizzo.
Script open-source
Nello spirito di TradingView, l'autore di questo script lo ha reso open source, in modo che i trader possano esaminarne e verificarne la funzionalità. Complimenti all'autore! Sebbene sia possibile utilizzarlo gratuitamente, ricordiamo che la ripubblicazione del codice è soggetta al nostro Regolamento.
Trusted Pine programmer. Send me a message for script development.
Declinazione di responsabilità
Le informazioni e le pubblicazioni non sono intese come, e non costituiscono, consulenza o raccomandazioni finanziarie, di investimento, di trading o di altro tipo fornite o approvate da TradingView. Per ulteriori informazioni, consultare i Termini di utilizzo.