OPEN-SOURCE SCRIPT
EQ LEVELS / Equilibrium
What is it, How to use it, How to adjust the settings? What Calculates EQ Level?
What is it?
EQ, Equilibrium, In the money market, the term "equilibrium" or "equilibrium" refers to the point at which supply and demand are equalised. At this point, money supply and money demand meet each other and interest rates stabilise at a certain level. Equilibrium in the money market reflects the overall financial balance in the economy
According to What Calculates the EQ Level?
Normally, there may be many different alternatives to this, but I have printed the result on the screen by adding the highest and lowest levels of the prices and averaging them to think of a simple solution.
How to use it?
I have added 4 timeframes for both long-term investors and traders to use. If you want to use which timeframe, you can select the timeframe you want from the settings and see it on the chart. For those who want to trade, my suggestion is to follow the daily eq levels and of course look at the weekly eq levels. The weekly eq level can give you an idea of what kind of price range the next day may be in.
How to Make Settings?
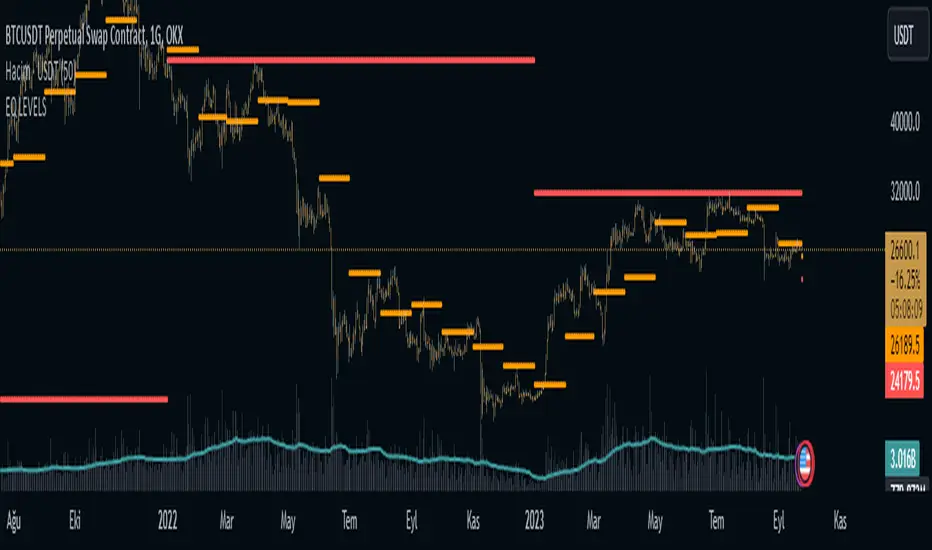
When you first add the indicator to the chart, it draws a line. You change it to a circle or plus in the settings, it will look like the picture I shared. I also share open source code and can make changes in the code.
Nedir?, Nasıl Kullanılır?, Ayarları Nasıl Yapılır? EQ Seviyesini Neye Göre Hesaplar?
Nedir?:
EQ yani Equilibrium, Para piyasasında "denge" veya "equilibrium" terimi, arz ve talebin eşitlendiği noktayı ifade eder. Bu noktada, para arzı ile para talebi birbirini karşılar ve faiz oranları belirli bir seviyede dengelenir. Para piyasasındaki denge, ekonomideki genel finansal dengeyi yansıtır
EQ Seviyesini Neye Göre Hesaplar?
Normalde bunun farlı bir çok alternatifi olabilir ama ben biraz basit bir çözüm düşünmek için fiyatların en yüksek ve en düşük seviyelerini toplayarak ve ortalamasını alarak çıka sonucu ekrana yazdırdım.
Nasıl Kullanılır?
Hem uzun vadeli yatırım yapanlar hem de trade yapanların kullanabilmesi için 4 zaman dilimi ekledim. Hangi zaman dilimini kullanmak istiyorsanız ayarlardan istediniz zaman dilimini seçip onu grafikte görebilirsiniz. Trade yapmak isteyenler için önerim günlük eq seviyelerini takip etmeleri ve tabiki haftalık eq seviyelerine bakın. Haftalık eq seviyesi size bir sonra ki günün nasıl bir fiyat aralığı içerisinde olabileceği konusunda fikir verebilir.
Ayarları Nasıl Yapılır?
Grafiğe indikatörü ilk eklediğiniz de çizgi çizdirir. Siz ayarlardan onu daire veya artı olarak değiştirin benim paylaştığım resimde ki gibi görünecektir. Ayrıca açık kaynak kodlu paylaşıyorum isteyen kod içerisinde değişiklikler yapabilir.
What is it?
EQ, Equilibrium, In the money market, the term "equilibrium" or "equilibrium" refers to the point at which supply and demand are equalised. At this point, money supply and money demand meet each other and interest rates stabilise at a certain level. Equilibrium in the money market reflects the overall financial balance in the economy
According to What Calculates the EQ Level?
Normally, there may be many different alternatives to this, but I have printed the result on the screen by adding the highest and lowest levels of the prices and averaging them to think of a simple solution.
How to use it?
I have added 4 timeframes for both long-term investors and traders to use. If you want to use which timeframe, you can select the timeframe you want from the settings and see it on the chart. For those who want to trade, my suggestion is to follow the daily eq levels and of course look at the weekly eq levels. The weekly eq level can give you an idea of what kind of price range the next day may be in.
How to Make Settings?
When you first add the indicator to the chart, it draws a line. You change it to a circle or plus in the settings, it will look like the picture I shared. I also share open source code and can make changes in the code.
Nedir?, Nasıl Kullanılır?, Ayarları Nasıl Yapılır? EQ Seviyesini Neye Göre Hesaplar?
Nedir?:
EQ yani Equilibrium, Para piyasasında "denge" veya "equilibrium" terimi, arz ve talebin eşitlendiği noktayı ifade eder. Bu noktada, para arzı ile para talebi birbirini karşılar ve faiz oranları belirli bir seviyede dengelenir. Para piyasasındaki denge, ekonomideki genel finansal dengeyi yansıtır
EQ Seviyesini Neye Göre Hesaplar?
Normalde bunun farlı bir çok alternatifi olabilir ama ben biraz basit bir çözüm düşünmek için fiyatların en yüksek ve en düşük seviyelerini toplayarak ve ortalamasını alarak çıka sonucu ekrana yazdırdım.
Nasıl Kullanılır?
Hem uzun vadeli yatırım yapanlar hem de trade yapanların kullanabilmesi için 4 zaman dilimi ekledim. Hangi zaman dilimini kullanmak istiyorsanız ayarlardan istediniz zaman dilimini seçip onu grafikte görebilirsiniz. Trade yapmak isteyenler için önerim günlük eq seviyelerini takip etmeleri ve tabiki haftalık eq seviyelerine bakın. Haftalık eq seviyesi size bir sonra ki günün nasıl bir fiyat aralığı içerisinde olabileceği konusunda fikir verebilir.
Ayarları Nasıl Yapılır?
Grafiğe indikatörü ilk eklediğiniz de çizgi çizdirir. Siz ayarlardan onu daire veya artı olarak değiştirin benim paylaştığım resimde ki gibi görünecektir. Ayrıca açık kaynak kodlu paylaşıyorum isteyen kod içerisinde değişiklikler yapabilir.
Script open-source
In pieno spirito TradingView, il creatore di questo script lo ha reso open-source, in modo che i trader possano esaminarlo e verificarne la funzionalità. Complimenti all'autore! Sebbene sia possibile utilizzarlo gratuitamente, ricorda che la ripubblicazione del codice è soggetta al nostro Regolamento.
Declinazione di responsabilità
Le informazioni ed i contenuti pubblicati non costituiscono in alcun modo una sollecitazione ad investire o ad operare nei mercati finanziari. Non sono inoltre fornite o supportate da TradingView. Maggiori dettagli nelle Condizioni d'uso.