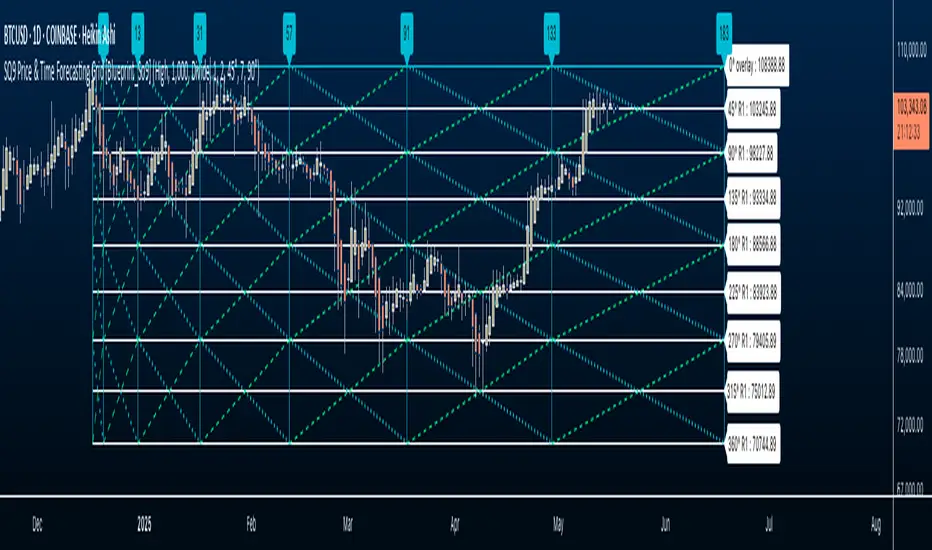
Square of Nine Price & Time Forecasting Grid
Adapted and Interpreted by Javonnii | Inspired by Patrick Mikula
The So9 Price and Time Forecasting Grid is a self-contained forecasting grid that allows traders to visually forecast levels in both price and time, using only Square of Nine calculations.
This indicator dynamically generates an expandable grid of angles, levels, and timeline based on the placement of a single anchor point, typically from a significant high or low. It requires no manual drawing or external tools.
🔍 How It Works:
The So9 Price and Time Forecasting Grid uses Square of Nine calculation and rotational logic to project price levels, time intervals, and internal angular structure from a single anchor point.
Once applied to the chart, the grid self-generates:
• Price levels using 360° degree Square of Nine intervals
• Timeline projections using Square of Nine progression intervals
• Diagonal and cardinal cross angles that dynamically propagate from the anchor
• Granular diagonal angle control, letting you refine internal grid resolution for tighter price structural analysis in relation to the forecasting grid.
⚙️ Setup Instructions
1. Select a Significant Pivot:
After loading the indicator, you’ll be prompted to select a significant high or low on your chart. This serves as the anchor point for the entire grid.
2. Price Grid Auto-Population:
Once anchored, Square of Nine price levels will automatically populate on the chart. These levels reflect Dynamic Square of Nine intervals from the anchor using rotational math.
3. Scale to Fit Your Instrument:
Use the provided UI settings to scale the grid to fit your instrument’s price structure. This ensures the levels align with actual historical price.
4. Engage Timelines:
Activate the timeline progression feature to generate forward-projected time intervals using Square of Nine-based timing logic. The entire grid can be extended up to 500 bars ahead on any timeframe.
5. Add Diagonal Angles:
Select which Square of Nine angle resolution you’d like to overlay from either the cardinal cross or diagonal cross based on Square of Nine geometry. This will populate diagonal levels within the grid, creating a full structural grid.
6. Customize Visuals:
You can toggle or hide price levels, timelines, or diagonal angles independently.
The entire grid can also be color-coded and customized to match your charting preferences.
All elements are plotted automatically. There is no manual drawing or calculation required. You can toggle the components on or off based on your workflow:
• Hide price levels if you just want time lines.
• Focus on angles without price levels.
• Use timeline progression independently.
📘 Attribution and Permission
This tool is inspired by concepts from "The Definitive Guide to Forecasting Using W.D. Gann’s Square of Nine" by Patrick Mikula.
The indicator reflects my personal adaptation and implementation of these forecasting principles within TradingView.
I have asked for and received permission from Patrick Mikula to share and publish tools derived from his work.
This applies to this script and to any other indicators I’ve developed that incorporate or build upon his material.
Documentation of this permission is available upon request.
Credit and respect to Patrick Mikula for his contributions to Gann-based research and for granting me the opportunity to share these tools with others.
Script su invito
Solo gli utenti approvati dall'autore possono accedere a questo script. È necessario richiedere e ottenere l'autorizzazione per utilizzarlo. Tale autorizzazione viene solitamente concessa dopo il pagamento. Per ulteriori dettagli, seguire le istruzioni dell'autore riportate di seguito o contattare direttamente BlueprintResearch.
TradingView NON consiglia di acquistare o utilizzare uno script a meno che non si abbia piena fiducia nel suo autore e se ne comprenda il funzionamento. È inoltre possibile trovare alternative gratuite e open source nei nostri script della community.
Istruzioni dell'autore
Declinazione di responsabilità
Script su invito
Solo gli utenti approvati dall'autore possono accedere a questo script. È necessario richiedere e ottenere l'autorizzazione per utilizzarlo. Tale autorizzazione viene solitamente concessa dopo il pagamento. Per ulteriori dettagli, seguire le istruzioni dell'autore riportate di seguito o contattare direttamente BlueprintResearch.
TradingView NON consiglia di acquistare o utilizzare uno script a meno che non si abbia piena fiducia nel suo autore e se ne comprenda il funzionamento. È inoltre possibile trovare alternative gratuite e open source nei nostri script della community.