PROTECTED SOURCE SCRIPT
Aggiornato [blackcat] L3 Institutional Trend
OVERVIEW The "Institutional Trend" indicator is designed to identify potential buying and selling signals through various financial metrics and indicators. It utilizes custom functions, EMAs, and adaptive smoothers to plot colored candles representing different market conditions and provide actionable buy/sell signals.
FEATURES
Input Parameter: Allows users to define the EMA period.
Double EMA Calculation: Smooths out volatility using a double EMA.
Adaptive Smoothing: Uses ALMA to adaptively smooth percentage changes between EMAs.
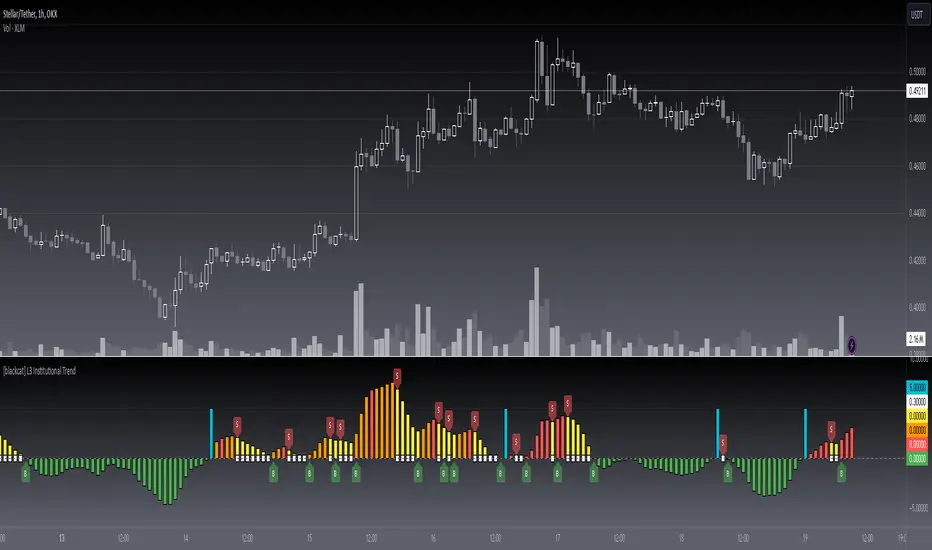
Colored Candle Plotting: Displays green, red, orange, yellow, aqua, and white candles based on various conditions.
Signal Generation: Provides buy, take profit, and sell signals based on defined criteria.
Labels: Shows buy ('B') and sell ('S') labels at trade entry points.
HOW TO USE
Add the script to your chart in TradingView.
Adjust the emaPeriod input parameter to customize the EMA calculation period.
Analyze the colored candles and labels for trading signals.
Monitor green candles for downward momentum, red candles for increasing positive control, orange candles for strong buying pressure, yellow candles for decreasing but positive control, aqua candles for potential institutional trials, and white candles for retail activity.
Execute trades based on the visual cues provided by the indicator.
LIMITATIONS
The indicator relies on historical data and statistical models, which may not always predict market moves accurately.
Over-reliance on automated signals can lead to missed opportunities or incorrect decisions.
Users should combine this indicator with other technical analysis tools for better risk management.
NOTES
Ensure proper backtesting before relying solely on the indicator's signals for live trading.
Customize the emaPeriod to suit your preferred timeframe and market conditions.
THANKS
Special thanks to [Author Name], whose original work inspired parts of this script.
FEATURES
Input Parameter: Allows users to define the EMA period.
Double EMA Calculation: Smooths out volatility using a double EMA.
Adaptive Smoothing: Uses ALMA to adaptively smooth percentage changes between EMAs.
Colored Candle Plotting: Displays green, red, orange, yellow, aqua, and white candles based on various conditions.
Signal Generation: Provides buy, take profit, and sell signals based on defined criteria.
Labels: Shows buy ('B') and sell ('S') labels at trade entry points.
HOW TO USE
Add the script to your chart in TradingView.
Adjust the emaPeriod input parameter to customize the EMA calculation period.
Analyze the colored candles and labels for trading signals.
Monitor green candles for downward momentum, red candles for increasing positive control, orange candles for strong buying pressure, yellow candles for decreasing but positive control, aqua candles for potential institutional trials, and white candles for retail activity.
Execute trades based on the visual cues provided by the indicator.
LIMITATIONS
The indicator relies on historical data and statistical models, which may not always predict market moves accurately.
Over-reliance on automated signals can lead to missed opportunities or incorrect decisions.
Users should combine this indicator with other technical analysis tools for better risk management.
NOTES
Ensure proper backtesting before relying solely on the indicator's signals for live trading.
Customize the emaPeriod to suit your preferred timeframe and market conditions.
THANKS
Special thanks to [Author Name], whose original work inspired parts of this script.
Note di rilascio
Correct BS signalNote di rilascio
Hey there, fellow traders! Today, I'm excited to present the "[blackcat] L3 Institutional Trend" – a powerful Pine Script designed to give you an edge in understanding market dynamics like never before. This script dives deep into the behaviors of both institutions and retail investors, using advanced calculations to separate the wheat from the chaff.At its core, this indicator leverages Exponential Moving Averages (EMAs) to smooth out price data, combined with Adaptive Length Moving Average (ALMA) to provide a more responsive signal. It then analyzes these moving averages to determine trends and potential reversals.
The magic happens through the calculation of something called "institutional control," which measures when major players are likely exerting influence over the asset's price movement. By looking at factors like total shares outstanding and volume, it gauges whether institutions are buying or selling heavily.
But wait, it doesn't stop there! The script also incorporates a "winner percentage" metric, which assesses how much of the recent price action has been favorable compared to historical benchmarks. If the winner percentage exceeds a certain threshold, it might be signaling a strong uptrend driven by institutional enthusiasm.
To make things even clearer, the script uses colorful candlestick plots to visually represent different states of market sentiment:
- Green Candles: Represent moments when institutional control is weakening, possibly indicating a shift towards bearish pressure.
- Red Candles: Highlight instances where institutional control is strengthening and staying positive, suggesting bullish momentum.
- Orange Candles: Pinpoint situations where the winner percentage is high, costs are low relative to the current price, and institutional control remains positive – a triple-threat setup that could precede significant moves.
- Yellow Candles: Signal declines in institutional control while still remaining positive, hinting at possible pullbacks or corrections.
Additionally, the script introduces concepts like "instituional retreat" and "institutional trial," providing layers of analysis to help traders navigate complex market sentiment。
How Can You Benefit?
By incorporating this script into your trading arsenal, you can gain valuable insights into the intentions behind market movements. Whether you're a seasoned pro or just starting out, being able to distinguish between institutional and retail activities can offer a competitive advantage.
For beginners, think of it as having a secret map that reveals hidden treasures within the charts. For veterans, it’s like upgrading your radar system to detect subtle shifts in investor behavior.
Customization Options:
While the default settings should work well across various markets, feel free to tweak the EMA period (emaPeriod) if you prefer a smoother or more reactive trend line. Additionally, you can adjust other input parameters according to your strategy needs.
Interpreting Signals:
- Green Candles: Time to consider reducing long positions or considering short opportunities.
- Red Candles: Bullish phase; holding onto longs or entering new buys might be wise.
- Orange Candles: Potentially lucrative entry points; these may indicate strong upside bias.
- Yellow Candles: Caution ahead; monitor for any signs of reversal.
Moreover, watch for crosses and crossovers, such as control crossing above zero, which could signify turning points in market direction.
In summary, "[blackcat] L3 Institutional Trend" aims to demystify market signals by integrating multiple analytical techniques into one comprehensive tool. With vivid visual cues and actionable alerts, it's designed to help traders make informed decisions backed by solid data-driven insights.
So go ahead, add this script to your chart, and start uncovering those elusive patterns that professional traders rely on. Happy trading!
Script protetto
Questo script è pubblicato come codice protetto. Tuttavia, è possibile utilizzarle liberamente e senza alcuna limitazione – ulteriori informazioni qui.
Avoid losing contact!Don't miss out! The first and most important thing to do is to join my Discord chat now! Click here to start your adventure: discord.com/invite/ZTGpQJq 防止失联,请立即行动,加入本猫聊天群: discord.com/invite/ZTGpQJq
Declinazione di responsabilità
Le informazioni e le pubblicazioni non sono intese come, e non costituiscono, consulenza o raccomandazioni finanziarie, di investimento, di trading o di altro tipo fornite o approvate da TradingView. Per ulteriori informazioni, consultare i Termini di utilizzo.