PROTECTED SOURCE SCRIPT
Aggiornato CyCLOPE
CyCLOPE - CYCLe OPErator
by Antonio Pace 2022
All right reserved
The script uses time series decomposition tecniques for decompose the price signal into 10 harmonics waves of increasing
period and wavelength, the sum of which is the signal itself, to eliminate background noise and show a cleaner signal.
Also divides the high frequencies (secondary, short period trend) from the primary trend (long period trend),
which is composed of low frequencies, and show both separately.
Find highs and lows and indicate possible trend reversals, and favorable entry or exit points.
T0 is the basic harmonic with period 8 Time Unit (TU) of the current timeframe.
T1 has a double period compared to T0, T2 has a double period compared to T1 and so on.
The script composes the primary trend by adding the First 5 harmonics of the longer period (T7 + T6 + T5 + T4 + T3), therefore of low frequency.
This eliminates the noise (short-term retracements) from the main trend.
Similarly, it reconstructs the secondary trend (a possible retracement of a primary trend) by adding the two harmonics with the high frequency (T2 + T1)
T0 the harmonic with highest frequency it is too noisy for this TimeFrame and is left out.
The script then identifies the maximums and minimums of the primary trend and the secondary trend, indicating possible trend reversal points or favorable entry points in a continuing trend.
The script finds the maxima and minima of the reconstructed signal so as to have as little noise as possible.
The reconstructed signal is shown on the screen. The blue line for the long term trend and the orange line for the short time trend.
If the cloud changes from red to green, it means that a local minimum has formed on the main tred, we are in the presence of a possible bullish inversion.
If the cloud turns from green to red then a local high has formed, a bearish trend reversal may have started.
The line on the cloud represents the subtrend instead.
If the line goes from green to red it has formed a maximum and if it goes from red to green it has formed a minimum.
For instance:
If the line is red and the cloud becomes red we are in the presence of a possible inversion and the beginning of a bearish trend.
I exit the long position and into the short position.
Similarly If the cloud is red and the line is green it means that I have a rising subtrend in a bearish dominate trend.
If the line turns red I have a bearish entry point.
If the cloud turns green the low of the subtrend has also become a low of the main trend, a bullish trend has started.
The script is designed to run on a daily timeframe, but it should work on any timeframe provided there are enough Time Units (1024 TU) in the past.
Minimum usable timeframe: 8h, at shorter timeframes the signal becomes indistinguishable from noise.
when the main trend and the sub-trend have the same magnitude, that is, the line and the cloud have the same size, but different color the noise prevails,
there is no valid information.
Wait for them to become the same color to enter the market again.
Once you have chosen the timeframe and asset on which to operate, select the harmonics to compose the main trend and those to compose the secondary trend
so that the indicator matches as much as possible with the real results.
Looking for the right balance between signal and noise and then continuing to use these settings, for this specific timeframe.
if you don't want have both Long Term and Short Trend trend on screen you can hide the short therm and add is harmonic to LongTime trend
in these case gren cloud indicate long and red color indicate short.
VERY IMPORTANT!
THE LONG TERM TREND DOMINATE OVER THE SHORT TERM TREND EXCEPT WHERE BOTH HAVE SAME MAGNITUDE.
The short term trend describe price retracemet over long term trend,
enter to market only when both have the same color.
Use short therm trend to find maximum or minimum of retracement.
FIND AND USE THE MINIMUM NUMBER OF WAVE PER TREND, THE RISK IS OVER FITTING THE PRICE LINE AND CREATE CONFUSION.
THE SCRIPT WORK BEST FOR DAILY TIMEFRAME AND COME CONFIGURED FOR THIS.
Note di rilascio
Modifyed default setting.Note di rilascio
Little parameter adjustement.Note di rilascio
Minor changesNote di rilascio
Bug CorrectionNote di rilascio
Minor correctionsNote di rilascio
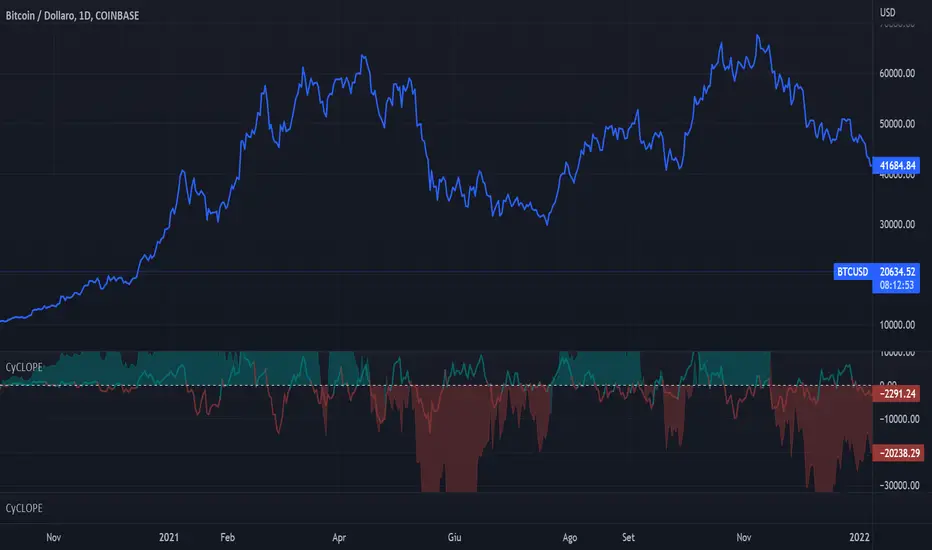
VERY IMPORTANT! Added LongTerm vs Short Term Signal Strength, blue LongTerm, yellow ShortTerm.Note di rilascio
Minor UpdatesNote di rilascio
Cosmetic UpgradeNote di rilascio
Minuor UpdatesNote di rilascio
bug fixNote di rilascio
Default configuration update.Note di rilascio
Bug Fixes.Note di rilascio
Update default settings.Note di rilascio
Small update to default initial values.Note di rilascio
Small updates.Note di rilascio
Updated default.Note di rilascio
Minor improvementsNote di rilascio
minor updatesScript protetto
Questo script è pubblicato come codice protetto. Tuttavia, è possibile utilizzarlo liberamente e senza alcuna limitazione – per saperne di più clicca qui.
Declinazione di responsabilità
Le informazioni ed i contenuti pubblicati non costituiscono in alcun modo una sollecitazione ad investire o ad operare nei mercati finanziari. Non sono inoltre fornite o supportate da TradingView. Maggiori dettagli nelle Condizioni d'uso.
Script protetto
Questo script è pubblicato come codice protetto. Tuttavia, è possibile utilizzarlo liberamente e senza alcuna limitazione – per saperne di più clicca qui.
Declinazione di responsabilità
Le informazioni ed i contenuti pubblicati non costituiscono in alcun modo una sollecitazione ad investire o ad operare nei mercati finanziari. Non sono inoltre fornite o supportate da TradingView. Maggiori dettagli nelle Condizioni d'uso.