PROTECTED SOURCE SCRIPT
Aggiornato Dow Theory HH-HL-LH_LL 2025

https://www.tradingview.com/x/5NnYMiHx/
https://www.tradingview.com/x/jMCYXKjY/
https://www.tradingview.com/x/NBsdZbdA/
//--------------------------------------------
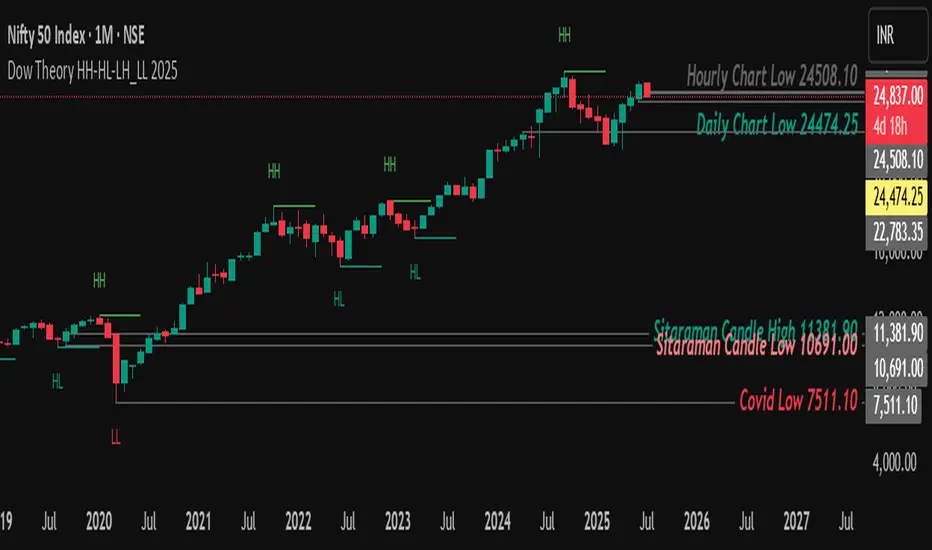
Dow Theory HH-HL-LH-LL 2025
//--------------------------------------------
✅ Purpose
This indicator visualizes Dow Theory structure by identifying:
//--------------------------------------------
Higher Highs (HH)
Higher Lows (HL)
Lower Highs (LH)
Lower Lows (LL)
//--------------------------------------------
It helps traders clearly identify market trends, trend reversals, and structure shifts in real time —
crucial for both swing and intraday traders.
//--------------------------------------------
⚙️ Key Features & User Settings
//--------------------------------------------
🟩 1. New Day Highlight
Show_New_Day: Toggle ON/OFF background color for new trading days.
ND_Fill_Transp: Set transparency level of the day start background Color Box Line.
📏 2. Pivot Point Settings
Pivot_Period: Set the period used to detect pivot highs/lows Default is 5.
🎯 3. Line & Label Display
Show_Line: Show/hide support/resistance lines at HH, HL, LH, LL.
Show_Lbl: Show/hide text labels on chart.
Show_With_Price: Display price along with HH-HL-LH-LL labels.
🎨 4. Visual Themes
Select_Theme: Choose between 'Color' or 'Gray' for a colorful or minimal style.
✍️ 5. Support/Resistance Line Style
Line Width, Line Style: Customize thickness and style of lines.
Line Transparency: Set transparency of lines.
🏷️ 6. Label Text Styling
Lbl_Transp: Set background transparency for labels Default is 100 You can Change it any time to Show Label Background.
Txt_Transp: Set text transparency Default is 0 .
Txt_Size: Adjust label font size Default is 10.
🟡🟡🟡 And Best Thing of Indicator is you can Check Price any time Hovering on the Label - For Quick Referance 🟡🟡🟡
//--------------------------------------------
Trend Direction
//--------------------------------------------
🔹 Identify trend continuation or reversal zones.
🔹 Mark structure breakpoints to place stop losses.
🔹 Confirm signals from other indicators (RSI, EMA, VWAP, etc.).
🔹 Analyze price action with pure structure — no lagging indicators.
Note di rilascio
//--------------------------------------------
Dow Theory HH-HL-LH-LL 2025
//--------------------------------------------
✅ Purpose
This indicator visualizes Dow Theory structure by identifying:
//--------------------------------------------
Higher Highs (HH)
Higher Lows (HL)
Lower Highs (LH)
Lower Lows (LL)
//--------------------------------------------
It helps traders clearly identify market trends, trend reversals, and structure shifts in real time —
crucial for both swing and intraday traders.
//--------------------------------------------
⚙️ Key Features & User Settings
//--------------------------------------------
🟩 1. New Day Highlight
Show_New_Day: Toggle ON/OFF background color for new trading days.
ND_Fill_Transp: Set transparency level of the day start background Color Box Line.
📏 2. Pivot Point Settings
Pivot_Period: Set the period used to detect pivot highs/lows Default is 5.
🎯 3. Line & Label Display
Show_Line: Show/hide support/resistance lines at HH, HL, LH, LL.
Show_Lbl: Show/hide text labels on chart.
Show_With_Price: Display price along with HH-HL-LH-LL labels.
🎨 4. Visual Themes
Select_Theme: Choose between 'Color' or 'Gray' for a colorful or minimal style.
✍️ 5. Support/Resistance Line Style
Line Width, Line Style: Customize thickness and style of lines.
Line Transparency: Set transparency of lines.
🏷️ 6. Label Text Styling
Lbl_Transp: Set background transparency for labels Default is 100 You can Change it any time to Show Label Background.
Txt_Transp: Set text transparency Default is 0 .
Txt_Size: Adjust label font size Default is 10.
🟡🟡🟡 And Best Thing of Indicator is you can Check Price any time Hovering on the Label - For Quick Referance 🟡🟡🟡
//--------------------------------------------
Trend Direction
//--------------------------------------------
🔹 Identify trend continuation or reversal zones.
🔹 Mark structure breakpoints to place stop losses.
🔹 Confirm signals from other indicators (RSI, EMA, VWAP, etc.).
🔹 Analyze price action with pure structure — no lagging indicators.
✅ Fix: Reset Label Repainting issue
Script protetto
Questo script è pubblicato come codice protetto. Tuttavia, è possibile utilizzarle liberamente e senza alcuna limitazione – ulteriori informazioni qui.
Declinazione di responsabilità
Le informazioni e le pubblicazioni non sono intese come, e non costituiscono, consulenza o raccomandazioni finanziarie, di investimento, di trading o di altro tipo fornite o approvate da TradingView. Per ulteriori informazioni, consultare i Termini di utilizzo.