KevinUtecht

WatchlistTracker

40
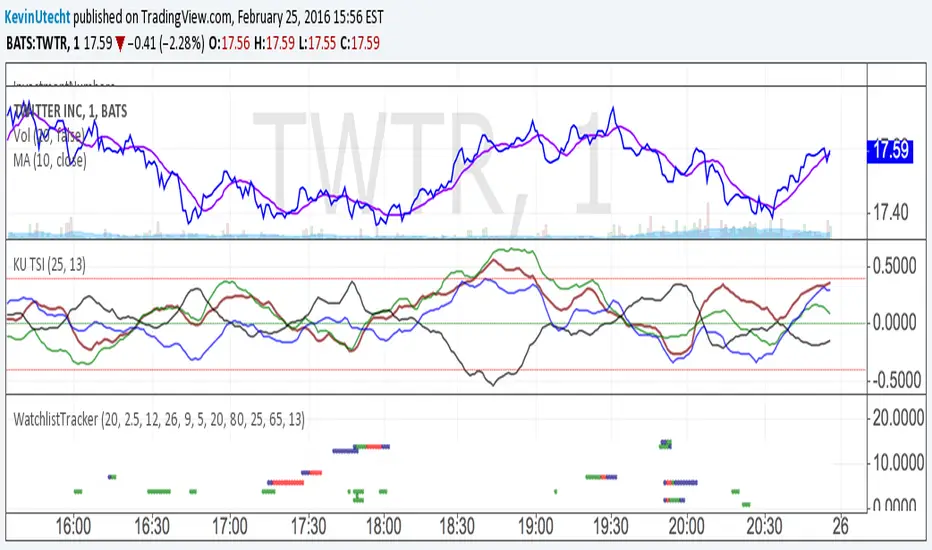
Provides a picture of multiple companies in one chart. This method alerts you to possible trades without having to click through items in the Watchlist. The companies are hard coded so some editing is required to customize to items you watch.
Script open-source

Nello spirito di condivisione promosso da TradingView, l'autore (al quale vanno i nostri ringraziamenti) ha deciso di pubblicare questo script in modalità open-source, così che chiunque possa comprenderlo e testarlo. Puoi utilizzarlo gratuitamente, ma il riutilizzo del codice è subordinato al rispetto del Regolamento. Per aggiungerlo al grafico, mettilo tra i preferiti.

Declinazione di responsabilità

Le informazioni ed i contenuti pubblicati non costituiscono in alcun modo una sollecitazione ad investire o ad operare nei mercati finanziari. Non sono inoltre fornite o supportate da TradingView. Maggiori dettagli nelle Condizioni d'uso.

Vuoi usare questo script sui tuoi grafici?
study(title = "WatchlistTracker", overlay=false)

//
// globals
//
successCount = 3 // 3 or more successes
getPrepared = -0.3500
overSold = -0.4000
prepColor = navy
triggerColor = red
longColor = green
spacer = 24
shortlen = 13
longlen = 25

//
// inputs
//
bollngrLen = input(defval=20, type=integer, minval=1, maxval=300) 
bollngrMult = input(defval=2.5, type=float, minval=0.1, maxval=50)
macdFastLen = input(12, minval=1) 
macdSlowLen = input(26, minval=1)
macdSignalLen = input(9, minval=1)
stochLen = input(5, minval=1)
stochEntry = input(20, minval=1)
stochExit = input(80, minval=1)
rsiEntry = input(25, minval=1)
rsiExit = input(65, minval=1)
rsiLen = input(defval=13,type=integer,minval=1,maxval=300)

//
// functions
//
countSuccesses(bollngrSuccess, macdSuccess, stochSuccess, rsiSuccess) =>
    count = (bollngrSuccess ? 1 : 0) + (macdSuccess ? 1 : 0) + (stochSuccess ? 1 : 0) + (rsiSuccess ? 1 : 0)
    count


bollngrBasis(s) => sma(s, bollngrLen)
bollngrDev(s) => bollngrMult * stdev(s, bollngrLen)
bollngrLowr(s) => bollngrBasis(s) - bollngrDev(s)


macdFastMA(s) => ema(s, macdFastLen)
macdSlowMA(s) => ema(s, macdSlowLen)
macd(s) => macdFastMA(s) - macdSlowMA(s)
macdSignal(s) => sma(s, macdSignalLen)

stochVal(s) => stoch(s, high, low, stochLen)

rsiVal(s) => rsi(s,rsiLen)


//
// calculate long signals - over the last 6 ticks
//
longSignals = 0

bollngrLong(s,bl) => (lowest(s,1) < bl) or (lowest(s,2) < bl[1]) or (lowest(s,3) < bl[2])  or (lowest(s,4) < bl[3]) or (lowest(s,5) < bl[4]) or (lowest(s,6) < bl[5])

macdLong(macd,macds) => (macd[1] <= macds[1] and macd > macds) or (macd[2] <= macds[2] and macd[1] > macds[1]) or (macd[3] <= macds[3] and macd[2] > macds[2]) or (macd[4] <= macds[4] and macd[3] > macds) or (macd[5] <= macds[5] and macd[4] > macds[4]) or (macd[6] <= macds[6] and macd[5] > macds[5])

stochLong(stoc) => (stoc[1] <= stochEntry and stoc > stochEntry) or (stoc[2] <= stochEntry and stoc[1] > stochEntry) or (stoc[3] <= stochEntry and stoc[2] > stochEntry) or (stoc[4] <= stochEntry and stoc[3] > stochEntry) or (stoc[5] <= stochEntry and stoc[4] > stochEntry) or (stoc[6] <= stochEntry and stoc[5] > stochEntry)

rsiLong(r) => (r[1] <= rsiEntry and r > rsiEntry) or (r[2] <= rsiEntry and r[1] > rsiEntry) or (r[3] <= rsiEntry and r[2] > rsiEntry) or (r[4] <= rsiEntry and r[3] > rsiEntry) or (r[5] <= rsiEntry and r[4] > rsiEntry) or (r[6] <= rsiEntry and r[5] > rsiEntry)


hline(spacer, linestyle=dashed, color=white)

sym(s) => security(s, period, close)
step3(t) => (t <= getPrepared) ? prepColor : white
step2(t) => (t <= overSold) ? triggerColor : step3(t)
status(s, bl, macd, macds, stoc, r, t) => countSuccesses(bollngrLong(s,bl), macdLong(macd,macds), stochLong(stoc), rsiLong(r)) >= successCount ? longColor : step2(t)

s1 = sym("GLW")
tsi1 = tsi(s1, shortlen, longlen)
bl1 = bollngrLowr(s1)
macd1 = macd(s1)
macds1 = macd(s1)
stoc1 = stochVal(s1)
rsi1 = rsiVal(s1)
plot(1,color=status(s1,bl1,macd1,macds1,stoc1,rsi1,tsi1),style=circles,linewidth=2)

s2 = sym("UA")
tsi2 = tsi(s2, shortlen, longlen)
bl2 = bollngrLowr(s2)
macd2 = macd(s2)
macds2 = macd(s2)
stoc2 = stochVal(s2)
rsi2 = rsiVal(s2)
plot(2,color=status(s2,bl2,macd2,macds2,stoc2,rsi2,tsi2),style=circles,linewidth=2)

s3 = sym("HPQ")
tsi3 = tsi(s3, shortlen, longlen)
bl3 = bollngrLowr(s3)
macd3 = macd(s3)
macds3 = macd(s3)
stoc3 = stochVal(s3)
rsi3 = rsiVal(s3)
plot(3,color=status(s3,bl3,macd3,macds3,stoc3,rsi3,tsi3),style=circles,linewidth=2)

s4 = sym("TWTR")
tsi4 = tsi(s4, shortlen, longlen)
bl4 = bollngrLowr(s4)
macd4 = macd(s4)
macds4 = macd(s4)
stoc4 = stochVal(s4)
rsi4 = rsiVal(s4)
plot(4,color=status(s4,bl4,macd4,macds4,stoc4,rsi4,tsi4),style=circles,linewidth=2)

s5 = sym("NKE")
tsi5 = tsi(s5, shortlen, longlen)
bl5 = bollngrLowr(s5)
macd5 = macd(s5)
macds5 = macd(s5)
stoc5 = stochVal(s5)
rsi5 = rsiVal(s5)
plot(5,color=status(s5,bl5,macd5,macds5,stoc5,rsi5,tsi5),style=circles,linewidth=2)

s6 = sym("YHOO")
tsi6 = tsi(s6, shortlen, longlen)
bl6 = bollngrLowr(s6)
macd6 = macd(s6)
macds6 = macd(s6)
stoc6 = stochVal(s6)
rsi6 = rsiVal(s6)
plot(6,color=status(s6,bl6,macd6,macds6,stoc6,rsi6,tsi6),style=circles,linewidth=2)

s7 = sym("BMY")
tsi7 = tsi(s7, shortlen, longlen)
bl7 = bollngrLowr(s7)
macd7 = macd(s7)
macds7 = macd(s7)
stoc7 = stochVal(s7)
rsi7 = rsiVal(s7)
plot(7,color=status(s7,bl7,macd7,macds7,stoc7,rsi7,tsi7),style=circles,linewidth=2)

s8 = sym("STJ")
tsi8 = tsi(s8, shortlen, longlen)
bl8 = bollngrLowr(s8)
macd8 = macd(s8)
macds8 = macd(s8)
stoc8 = stochVal(s8)
rsi8 = rsiVal(s8)
plot(8,color=status(s8,bl8,macd8,macds8,stoc8,rsi8,tsi8),style=circles,linewidth=2)

s9 = sym("GPRO")
tsi9 = tsi(s9, shortlen, longlen)
bl9 = bollngrLowr(s9)
macd9 = macd(s9)
macds9 = macd(s9)
stoc9 = stochVal(s9)
rsi9 = rsiVal(s9)
plot(9,color=status(s9,bl9,macd9,macds9,stoc9,rsi9,tsi9),style=circles,linewidth=2)

s10 = sym("MDT")
tsi10 = tsi(s10, shortlen, longlen)
bl10 = bollngrLowr(s10)
macd10 = macd(s10)
macds10 = macd(s10)
stoc10 = stochVal(s10)
rsi10 = rsiVal(s10)
plot(10,color=status(s10,bl10,macd10,macds10,stoc10,rsi10,tsi10),style=circles,linewidth=2)

s11 = sym("NXPI")
tsi11 = tsi(s11, shortlen, longlen)
bl11 = bollngrLowr(s11)
macd11 = macd(s11)
macds11 = macd(s11)
stoc11 = stochVal(s11)
rsi11 = rsiVal(s11)
plot(11,color=status(s11,bl11,macd11,macds11,stoc11,rsi11,tsi11),style=circles,linewidth=2)

s12 = sym("SBUX")
tsi12 = tsi(s12, shortlen, longlen)
bl12 = bollngrLowr(s12)
macd12 = macd(s12)
macds12 = macd(s12)
stoc12 = stochVal(s12)
rsi12 = rsiVal(s12)
plot(12,color=status(s12,bl12,macd12,macds12,stoc12,rsi12,tsi12),style=circles,linewidth=2)

s13 = sym("CELG")
tsi13 = tsi(s13, shortlen, longlen)
bl13 = bollngrLowr(s13)
macd13 = macd(s13)
macds13 = macd(s13)
stoc13 = stochVal(s13)
rsi13 = rsiVal(s13)
plot(13,color=status(s13,bl13,macd13,macds13,stoc13,rsi13,tsi13),style=circles,linewidth=2)

s14 = sym("BABA")
tsi14 = tsi(s14, shortlen, longlen)
bl14 = bollngrLowr(s14)
macd14 = macd(s14)
macds14 = macd(s14)
stoc14 = stochVal(s14)
rsi14 = rsiVal(s14)
plot(14,color=status(s14,bl14,macd14,macds14,stoc14,rsi14,tsi14),style=circles,linewidth=2)

s15 = sym("AAPL")
tsi15 = tsi(s15, shortlen, longlen)
bl15 = bollngrLowr(s15)
macd15 = macd(s15)
macds15 = macd(s15)
stoc15 = stochVal(s15)
rsi15 = rsiVal(s15)
plot(15,color=status(s15,bl15,macd15,macds15,stoc15,rsi15,tsi15),style=circles,linewidth=2)