OPEN-SOURCE SCRIPT
SMA Crossover Support & Resistance [Rami_LB]
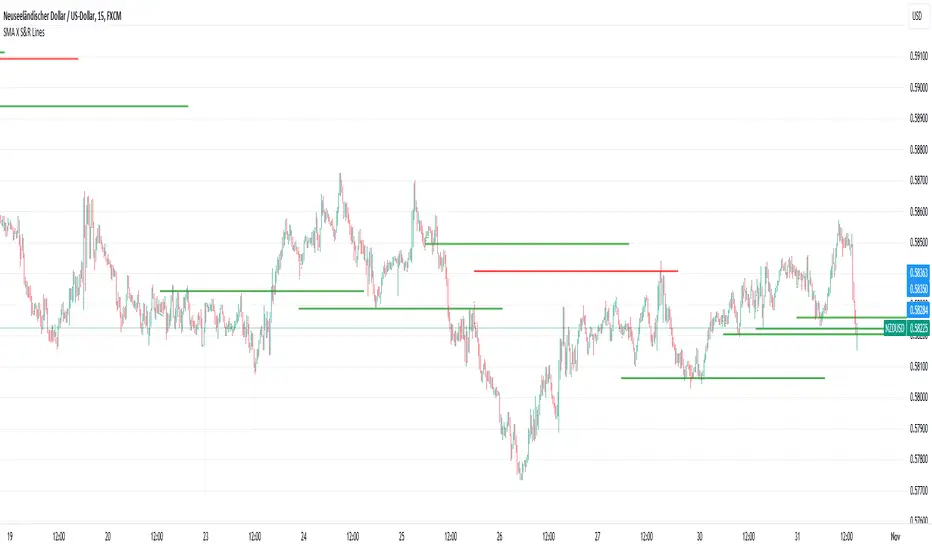
This indicator draws a horizontal line on the price chart at the point where two pre-defined SMA (Simple Moving Average) lines intersect. It is most useful for identifying crossed SMA lines on the 1-hour chart and then trading on smaller chart intervals.
For optimal performance, it is recommended to customize the values of the SMA lines individually for each currency pair, as these values can vary from one pair to another. To do this, switch to the 1-hour chart and adjust the SMA parameters until you visually observe that these settings would yield favorable results based on historical data. Certainly, you can also adjust the length of the lines accordingly when you switch from the 1-hour chart to smaller timeframes.
Please note that this indicator allows traders to visually identify potential trend changes and crossovers between short-term and long-term moving averages, aiding in decision-making for trading strategies.
Script open-source
In pieno spirito TradingView, il creatore di questo script lo ha reso open-source, in modo che i trader possano esaminarlo e verificarne la funzionalità. Complimenti all'autore! Sebbene sia possibile utilizzarlo gratuitamente, ricorda che la ripubblicazione del codice è soggetta al nostro Regolamento.
Declinazione di responsabilità
Le informazioni ed i contenuti pubblicati non costituiscono in alcun modo una sollecitazione ad investire o ad operare nei mercati finanziari. Non sono inoltre fornite o supportate da TradingView. Maggiori dettagli nelle Condizioni d'uso.