OPEN-SOURCE SCRIPT
Strong Levels (Safe Version)
Strong Levels (Safe Version)
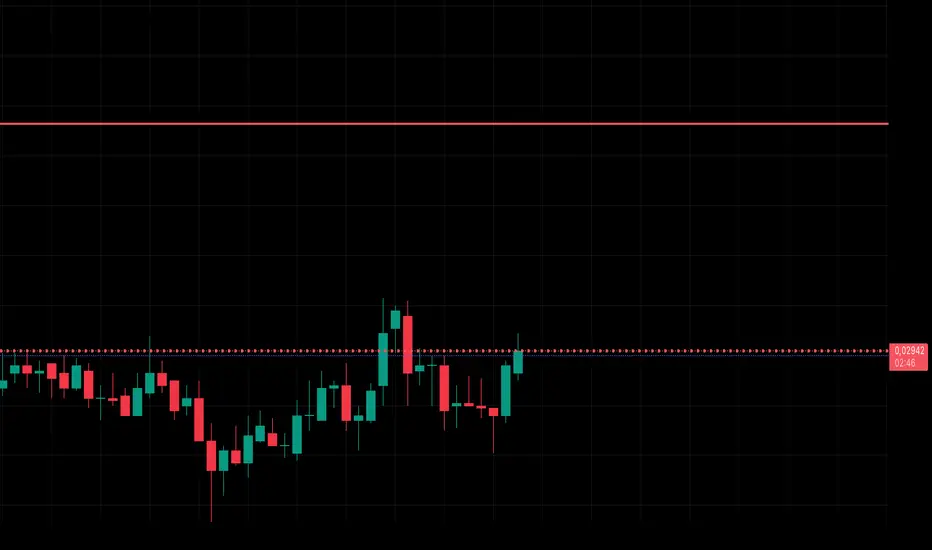
This indicator automatically detects and plots strong support and resistance levels based on pivot highs/lows and the number of touches. It’s designed to highlight only the most reliable levels by filtering with ATR tolerance and minimum touch requirements.
Features:
Detects pivot-based support and resistance zones
Adjustable left/right candles for pivot sensitivity
Minimum touches filter to confirm significant levels
ATR-based tolerance for flexible clustering of nearby levels
Maximum levels limit for cleaner charts
Automatic color coding (teal = support, red = resistance)
Safe version with optimized handling of line objects (up to 500 lines)
Parameters:
Left / Right candles – sensitivity of pivot detection
Min. touches – minimum confirmations required to display a level
ATR period & multiplier – tolerance range for grouping nearby levels
Max levels – limits the number of active levels
Colors – customize support and resistance lines
Usage:
This tool helps traders quickly identify the strongest price levels where market reactions are most likely. Use it to find high-probability entry, exit, or stop-loss zones in any market and timeframe.
Script open-source
In pieno spirito TradingView, il creatore di questo script lo ha reso open-source, in modo che i trader possano esaminarlo e verificarne la funzionalità. Complimenti all'autore! Sebbene sia possibile utilizzarlo gratuitamente, ricorda che la ripubblicazione del codice è soggetta al nostro Regolamento.
Declinazione di responsabilità
Le informazioni ed i contenuti pubblicati non costituiscono in alcun modo una sollecitazione ad investire o ad operare nei mercati finanziari. Non sono inoltre fornite o supportate da TradingView. Maggiori dettagli nelle Condizioni d'uso.