PROTECTED SOURCE SCRIPT
Time-to-Change RSI

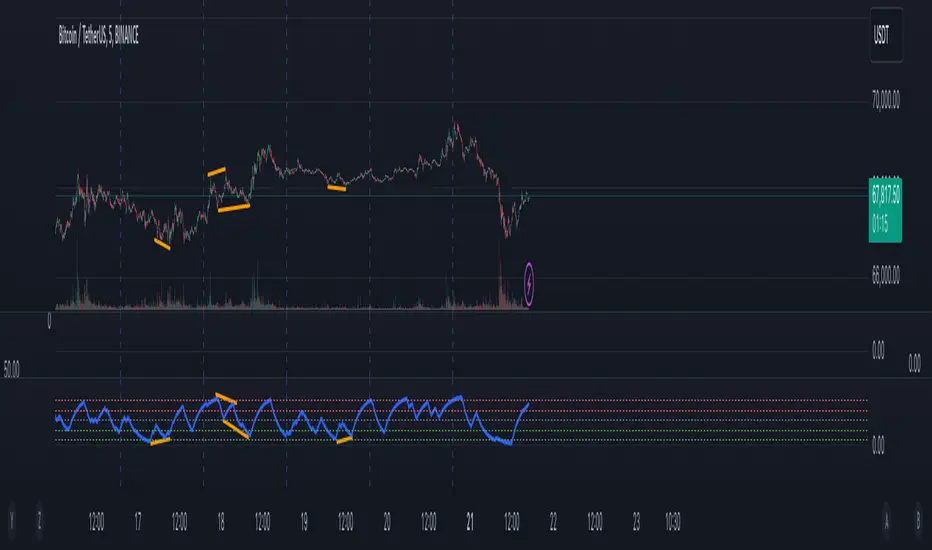
Instead of focusing on the price increase or decrease magnitude like the traditional RSI, this indicator calculates the time spent in positive (gain) and negative (loss) movements.
A gain time is counted whenever the price change is positive, and a loss time is counted whenever the price change is negative. The cumulative gain and loss time is tracked over the defined RSI period.
Smoothed Averages:
The indicator calculates the ratio between average gain time and average loss time (rs), similar to how traditional RSI uses price changes.
Using this ratio, the Time-to-Change RSI is calculated with the standard RSI formula but applied to time instead of price. The result oscillates between 0 and 100, where values above 70 indicate a market potentially overbought (spending more time rising than falling), and values below 30 indicate a market potentially oversold (spending more time falling than rising). There are also extreme zones/divergence zones.
Plotting:
The calculated Time-to-Change RSI is plotted in blue, allowing the user to visualize the time-weighted momentum of the market.
Reference lines at 70 (overbought), 30 (oversold), and 50 (neutral) are drawn for easy interpretation.
Key Features:
Time-Based Momentum Analysis: Instead of measuring how much the price changes, this indicator tracks how long the price has been moving up or down, providing a unique view of market momentum.
Visual Representation: The indicator plots the Time-to-Change RSI on a chart, along with standard overbought and oversold levels (70/30) and a neutral 50 line, making it easy to spot potential trend reversals.
Dynamic and Adaptive: By focusing on time spent in gains versus losses, this indicator adapts to different market conditions and helps traders identify periods of prolonged momentum in one direction.
This unique indicator can offer new perspectives in technical analysis by revealing trends and reversals based on the duration of price movements rather than the size of those movements. Traders looking for alternative momentum analysis tools may find the "Time-to-Change RSI" valuable for confirming market conditions or spotting trend changes.
Script protetto
Questo script è pubblicato come codice protetto. Tuttavia, è possibile utilizzarle liberamente e senza alcuna limitazione – ulteriori informazioni qui.
Declinazione di responsabilità
Le informazioni e le pubblicazioni non sono intese come, e non costituiscono, consulenza o raccomandazioni finanziarie, di investimento, di trading o di altro tipo fornite o approvate da TradingView. Per ulteriori informazioni, consultare i Termini di utilizzo.