OPEN-SOURCE SCRIPT
T3 3 Averages
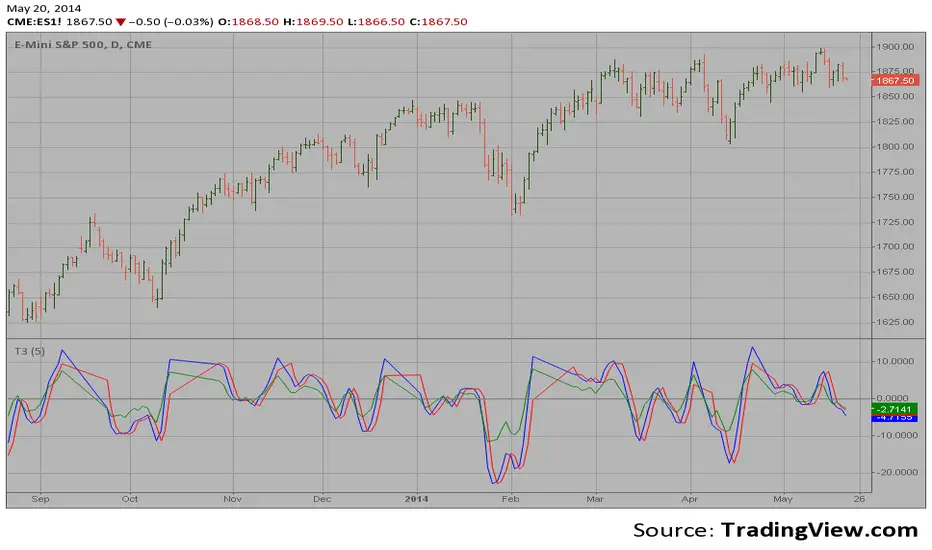
This function is an Pine version of the moving average described in
the January, 1998 issue of S&C magazine, p.57, "Smoothing Techniques
for More Accurate Signals", by Tim Tillson. It is translated from the
MetaStock code presented in the article. The function uses a version
of the XAverage, written by me, which allows variables as inputs.
The most popular method of interpreting a moving average is to compare
the relationship between a moving average of the security's price with
the security's price itself (or between several moving averages).
Script open-source
In pieno spirito TradingView, il creatore di questo script lo ha reso open-source, in modo che i trader possano esaminarlo e verificarne la funzionalità. Complimenti all'autore! Sebbene sia possibile utilizzarlo gratuitamente, ricorda che la ripubblicazione del codice è soggetta al nostro Regolamento.
Pubblicazioni correlate
Declinazione di responsabilità
Le informazioni ed i contenuti pubblicati non costituiscono in alcun modo una sollecitazione ad investire o ad operare nei mercati finanziari. Non sono inoltre fornite o supportate da TradingView. Maggiori dettagli nelle Condizioni d'uso.