PROTECTED SOURCE SCRIPT
DS Gurukul round up Nifty 250
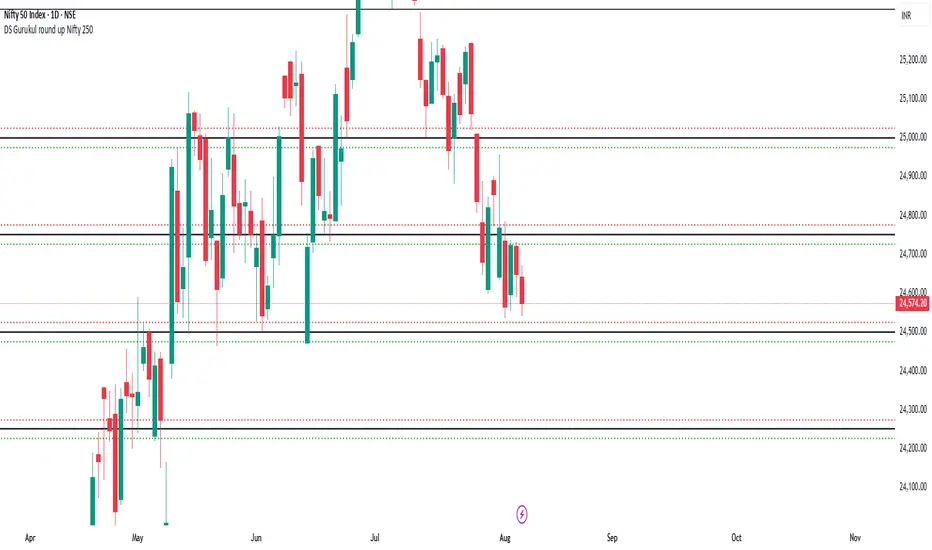
Roundup (Support & Resistance Indicator) For Nifty 50
By DS Gurukul
Version : 1.0
To be used only for Nifty 50.
Indicator Overview
The Round Figure Indicator identifies key psychological support and resistance levels based on round numbers. These levels often act as strong turning points in price action due to trader psychology and institutional order placement.
How It Works
Key Levels:
Mid Band (Black Solid Line): Major round number
Upper Band (Green Solid Line): Mid Band (resistance)
Lower Band (Red Solid Line): Mid Band (support)
Sub-Bands (Dotted Lines): ±0.10 levels for tighter zones
Alerts: Triggers when price touches any band, signaling potential reversals or breakouts.
Trading Strategy
✅ Bounce Trades:
Buy near Lower Band or Mid Sub-Lower with bullish confirmation (e.g., hammer candle).
Sell near Upper Band or Mid Sub-Upper with bearish rejection (e.g., shooting star).
✅ Breakout Trades:
Enter long on a close above Upper Band with volume.
Enter short on a close below Lower Band with momentum.
⚠️ Risk Management:
Place stops just beyond the opposite sub-band.
Avoid trading if price is stuck between mid/sub-bands (choppy market).
Why It Works
Round numbers attract limit orders (support/resistance).
Institutions use these levels for stop placements and profit targets.
Works across all timeframes (scalping to swing trading).
🔔 Tip: Combine with RSI/MACD for higher-probability trades!
Script protetto
Questo script è pubblicato come codice protetto. Tuttavia, è possibile utilizzarle liberamente e senza alcuna limitazione – ulteriori informazioni qui.
Declinazione di responsabilità
Le informazioni e le pubblicazioni non sono intese come, e non costituiscono, consulenza o raccomandazioni finanziarie, di investimento, di trading o di altro tipo fornite o approvate da TradingView. Per ulteriori informazioni, consultare i Termini di utilizzo.