PROTECTED SOURCE SCRIPT
CAT Volume Accumulation
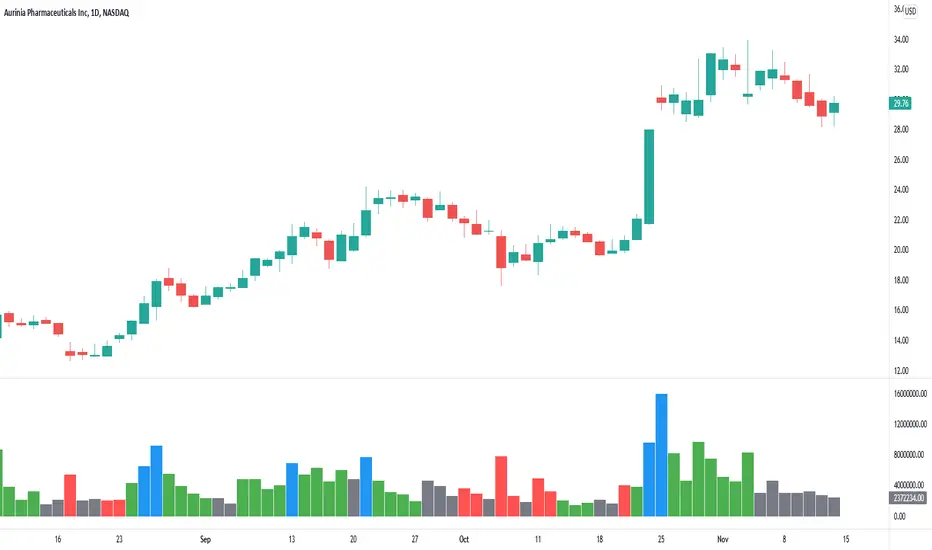
This indicator colors volume bars depending on change in price and volume. It helps traders to identify volume accumulation patterns.
The main interest for us is clusters of the blue bars and large green bars.
The blue volume bars are up days with unusually high trading volume .
Green bars are up days with normal trading volume .
Red bars are down days with elevated trading volume . It is not advisable to buy a stock on a day like that.
It makes sense to wait until a red down down is followed by a gray day, when price stop making lower low and trading volume dries down. That is a signal that bears lost momentum.
If we see a cluster of several blue bars that tells us there are institutional buyers building a position out there.
If we get a pullback that follows that volume accumulation pattern represented by several blue and large green bars that increases our chances for continuation of the move higher after a pullback.
Script protetto
Questo script è pubblicato come codice protetto. Tuttavia, è possibile utilizzarle liberamente e senza alcuna limitazione – ulteriori informazioni qui.
Join my Telegram channel: t.me/TheCastAwayTrader
Declinazione di responsabilità
Le informazioni e le pubblicazioni non sono intese come, e non costituiscono, consulenza o raccomandazioni finanziarie, di investimento, di trading o di altro tipo fornite o approvate da TradingView. Per ulteriori informazioni, consultare i Termini di utilizzo.