OPEN-SOURCE SCRIPT
ETN - Volume Candle
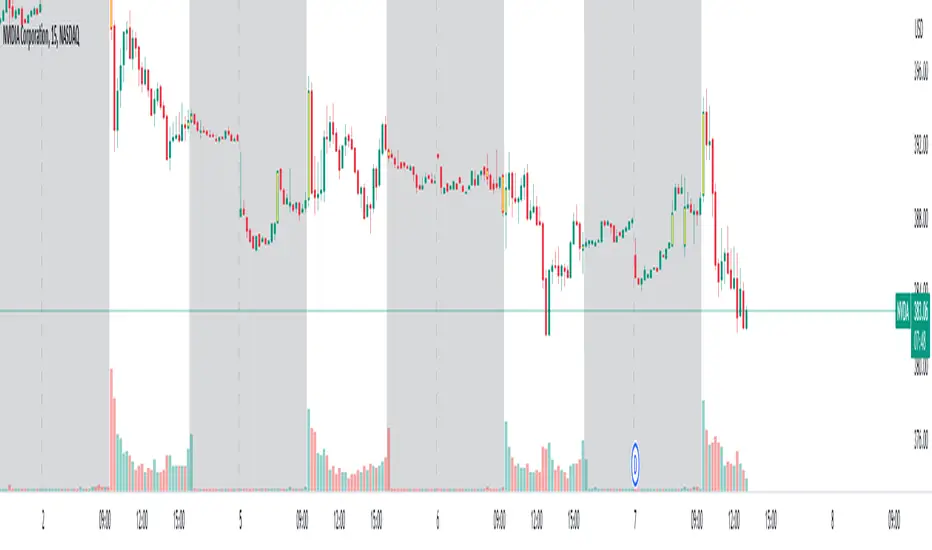
Highlights candlestick based on volume data.
Indicator looks back and analyzing volume to find the volume bar with the largest numerical value
Indicator highlights the corresponding candlestick.
Indicator marks the high and low of that candlestick.
Users can adjust lookback period. Default is set to 50.
Users can adjust how the indicator plots the high and low.
I currently have the high and low not being displayed on the charts until I come up with a better version.
On my chart, indicator colored the candlesticks YELLOW.
Script open-source
Nello spirito di TradingView, l'autore di questo script lo ha reso open source, in modo che i trader possano esaminarne e verificarne la funzionalità. Complimenti all'autore! Sebbene sia possibile utilizzarlo gratuitamente, ricordiamo che la ripubblicazione del codice è soggetta al nostro Regolamento.
Declinazione di responsabilità
Le informazioni e le pubblicazioni non sono intese come, e non costituiscono, consulenza o raccomandazioni finanziarie, di investimento, di trading o di altro tipo fornite o approvate da TradingView. Per ulteriori informazioni, consultare i Termini di utilizzo.