OPEN-SOURCE SCRIPT
EURNZD pairs combined slopes
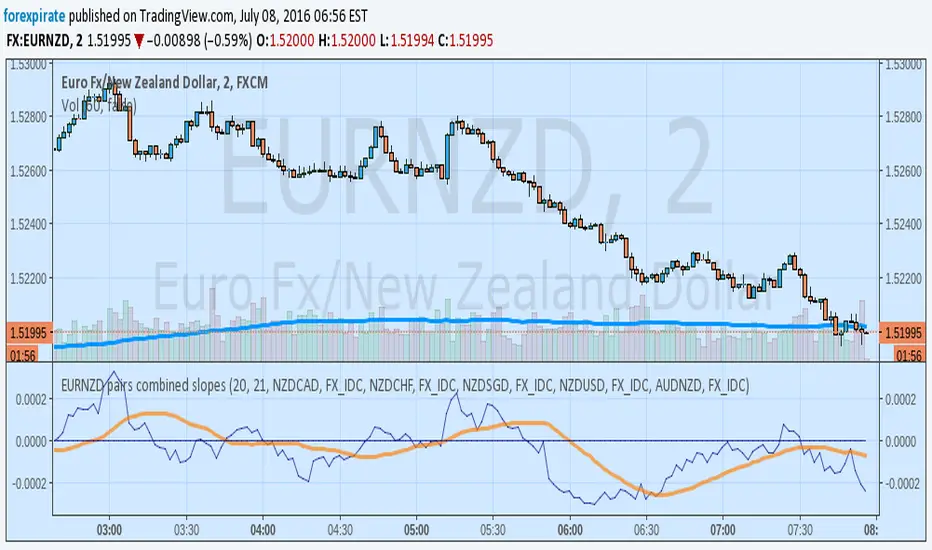
Indicator that combines slopes of most correlated pairs to EURNZD. Pairs were chosen using Oanda's correlation data. It combines highly correlated EURNZD pairs slopes to get a broad picture of the pressures on EURNZD
Script open-source
In pieno spirito TradingView, il creatore di questo script lo ha reso open-source, in modo che i trader possano esaminarlo e verificarne la funzionalità. Complimenti all'autore! Sebbene sia possibile utilizzarlo gratuitamente, ricorda che la ripubblicazione del codice è soggetta al nostro Regolamento.
Declinazione di responsabilità
Le informazioni ed i contenuti pubblicati non costituiscono in alcun modo una sollecitazione ad investire o ad operare nei mercati finanziari. Non sono inoltre fornite o supportate da TradingView. Maggiori dettagli nelle Condizioni d'uso.