OPEN-SOURCE SCRIPT
Aggiornato MARS - Moving Average Relative Strength
The original idea from this script is from the script "Percentage Relative Strength" by dman103. The original script compared a symbol to an index by their everyday percentage change. The symbol percentage was subtracted from percentage change of the index, & the results were then smoothed by moving averages.
Instead of daily percentage changes, this script directly calculates relative strength via a moving average. We call this simpler approach as MARS (Moving Average Relative Strength).
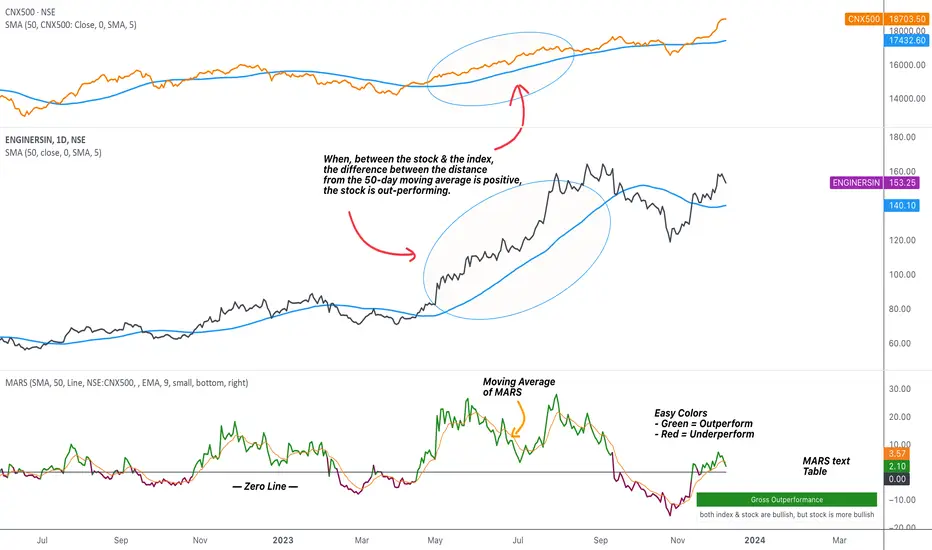
MARS compares a symbol to the index by making use of the price's distance from a moving average. By default, we compare the distance from the 50-day simple moving average of the stock vs that of the index. Both the type & the length of the moving average is customisable.
Background color indicates the index being above or below its moving average.
The histogram indicates whether the stock is under-performing or out-performing the index.
The color of the histogram indicates the type of out-performance or under-performance. There can be a total of 6 such colors:
Additional customisation options:
Instead of daily percentage changes, this script directly calculates relative strength via a moving average. We call this simpler approach as MARS (Moving Average Relative Strength).
MARS compares a symbol to the index by making use of the price's distance from a moving average. By default, we compare the distance from the 50-day simple moving average of the stock vs that of the index. Both the type & the length of the moving average is customisable.
Background color indicates the index being above or below its moving average.
- Blue background: index is above its moving average
- Pink background: index is below its moving average
The histogram indicates whether the stock is under-performing or out-performing the index.
- Up-bars: stock is out-performing the index i.e. between the stock & the index, the difference between the distance to/from the 50-day moving average is a positive value.
- Down-bars: stock is under-performing the index i.e. between the stock & the index, the difference between the distance to/from the 50-day moving average is a negative value.
The color of the histogram indicates the type of out-performance or under-performance. There can be a total of 6 such colors:
- Relative out-performance: both index & stock are bearish, but stock is less bearish. The script prints light green up-bars on a pink background.
- Gross out-performance: both index & stock are bullish, but stock is more bullish. The script prints green up-bars on a blue background.
- Absolute out-performance: index is bearish, but stock is bullish! The script prints blue up-bars on a pink background.
- Relative under-performance: both index & stock are bullish, but stock is less bullish. The script prints light red bars on a blue background.
- Gross under-performance: both index & stock are bearish, but stock is more bearish. The script prints dark red bars on a pink background.
- Absolute under-performance: index is bullish, but stock is bearish! The script prints black down-bars on a blue background.
Additional customisation options:
- Paint bars option changes the bar colors to mirror the histogram colors.
- Easy colors option just changes the histogram colors to either blue or pink, indicating out-performance or under-performance, respectively. This is when the trader does not wish to demarcate between the above-mentioned 6 conditions.
Note di rilascio
Minor bug fixes in the code.Note di rilascio
Added an option to change the colour of the Zero line.Note di rilascio
⦿ Default plot display is now a line style, instead of the previous histogram style. This is still user-customisable.⦿ Moving average for smoothing of MARS is now incorporated. By default, it uses a 9 EMA of MARS. If the MARS stays above its moving average, it indicates that MARS is going up, & is a bullish sign.
⦿ Text description of the current relative strength state is visible as a table. It is a verbose table by default (with details of the current MARS state). You can turn off the detailed text or even turn off the entire table altogether.
⦿ Easy color mode is modified & turned on by default. Easy colors are now really 'easy', as the strong & weak colors are now represented by green & red, respectively.
Note di rilascio
Updated to include more options in the 'Index to compare to' dropdown. Default now is NIFTYMIDSML400.Script open-source
In pieno spirito TradingView, il creatore di questo script lo ha reso open-source, in modo che i trader possano esaminarlo e verificarne la funzionalità. Complimenti all'autore! Sebbene sia possibile utilizzarlo gratuitamente, ricorda che la ripubblicazione del codice è soggetta al nostro Regolamento.
Declinazione di responsabilità
Le informazioni ed i contenuti pubblicati non costituiscono in alcun modo una sollecitazione ad investire o ad operare nei mercati finanziari. Non sono inoltre fornite o supportate da TradingView. Maggiori dettagli nelle Condizioni d'uso.
Script open-source
In pieno spirito TradingView, il creatore di questo script lo ha reso open-source, in modo che i trader possano esaminarlo e verificarne la funzionalità. Complimenti all'autore! Sebbene sia possibile utilizzarlo gratuitamente, ricorda che la ripubblicazione del codice è soggetta al nostro Regolamento.
Declinazione di responsabilità
Le informazioni ed i contenuti pubblicati non costituiscono in alcun modo una sollecitazione ad investire o ad operare nei mercati finanziari. Non sono inoltre fornite o supportate da TradingView. Maggiori dettagli nelle Condizioni d'uso.