PROTECTED SOURCE SCRIPT
GTO

GTO is a easy to understand and use script
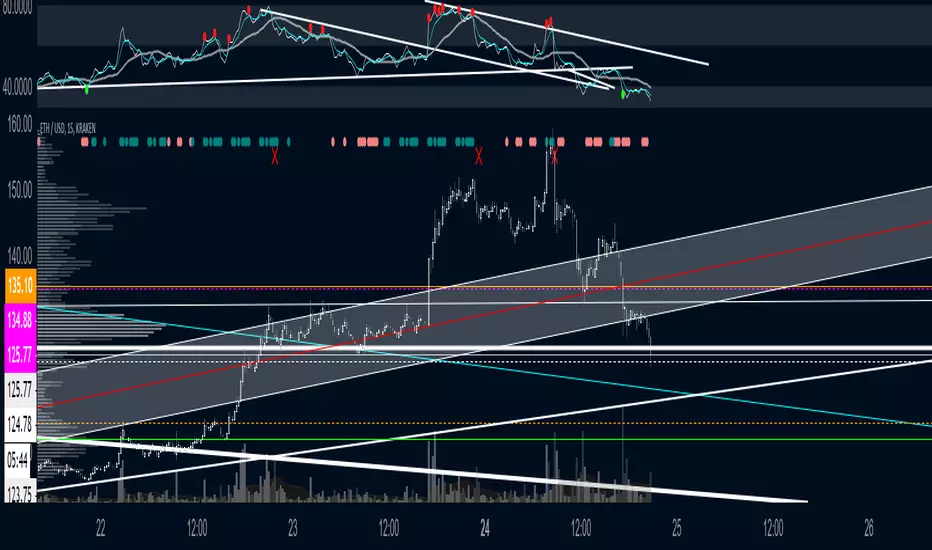
it just uses candle closes and other variables to gauge momentum that is then plotted on top of the chart
teal = bullish
salmon = bearish
you want them plotting while in your desired trade, if you are long and bearishness starts showing may be good toexit vise versa
Red X is BULL fatigue or can other wise be seen as bearish
Green X is the opposite
@satoshiiheavy
Technical Analyst for cryptcurrentlyvip.com
Script protetto
Questo script è pubblicato come codice protetto. Tuttavia, è possibile utilizzarle liberamente e senza alcuna limitazione – ulteriori informazioni qui.
Have a plan. Trade it!
Declinazione di responsabilità
Le informazioni e le pubblicazioni non sono intese come, e non costituiscono, consulenza o raccomandazioni finanziarie, di investimento, di trading o di altro tipo fornite o approvate da TradingView. Per ulteriori informazioni, consultare i Termini di utilizzo.